Exam 19: Understanding Regression Residuals
Exam 2: Data30 Questions
Exam 3: Surveys and Sampling28 Questions
Exam 4: Displaying and Describing Categorical Data32 Questions
Exam 5: Displaying and Describing Quantitative Data32 Questions
Exam 6: Scatterplots, Association, and Correlation32 Questions
Exam 7: Introduction to Linear Regression32 Questions
Exam 8: Randomness and Probability32 Questions
Exam 9: Random Variables and Probability Distributions28 Questions
Exam 10: Sampling Distributions28 Questions
Exam 11: Confidence Intervals for Proportions32 Questions
Exam 12: Testing Hypotheses About Proportions36 Questions
Exam 13: Confidence Intervals and Hypothesis Tests for Means36 Questions
Exam 14: Comparing Two Means32 Questions
Exam 15: Design of Experiments and Analysis of Variance Anova24 Questions
Exam 16: Inference for Counts: Chi-Square Tests26 Questions
Exam 17: Nonparametric Methods26 Questions
Exam 18: Inference for Regression32 Questions
Exam 19: Understanding Regression Residuals28 Questions
Exam 20: Multiple Regression22 Questions
Exam 21: Building Multiple Regression Models22 Questions
Exam 22: Time Series Analysis28 Questions
Exam 23: Decision Making and Risk32 Questions
Exam 24: Quality Control28 Questions
Exam 25: Exploring and Collecting Data32 Questions
Exam 26: Understanding Probability Distributions and Statistical Inference73 Questions
Exam 27: Exploring Relationships Among Variables40 Questions
Exam 28: Using Statistics for Decision Making26 Questions
Select questions type
A food company launches an advertising campaign for a high fibre cereal and wants to claim that high fibre cereals are lower in calories. In order to research this claim, they obtain nutritional information for 34 breakfast cereals including the amount of fibre (in grams) and the number of calories per serving. The data resulted in the following scatterplot. 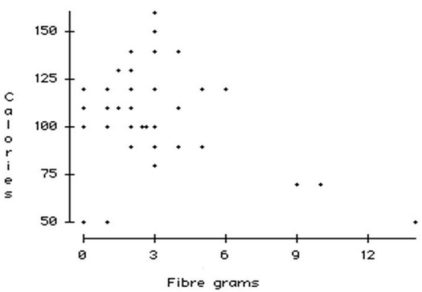 a. Do you think there is a clear pattern? Describe the association between fibre and calories.
b. Comment on any unusual data point or points in the data set. Explain.
c. Do you think a model could accurately predict the number of calories in a serving of cereal that has 22 grams of fibre? Explain.
a. Do you think there is a clear pattern? Describe the association between fibre and calories.
b. Comment on any unusual data point or points in the data set. Explain.
c. Do you think a model could accurately predict the number of calories in a serving of cereal that has 22 grams of fibre? Explain.
(Essay)
4.9/5  (42)
(42)
Consider the following to answer the question(s) below:
Consider the following scatter diagram for 24 of the top grossing movies of all time. The data include the highest grossing films for which world box office receipts and budgets were available. The top two were Avatar and Titanic. 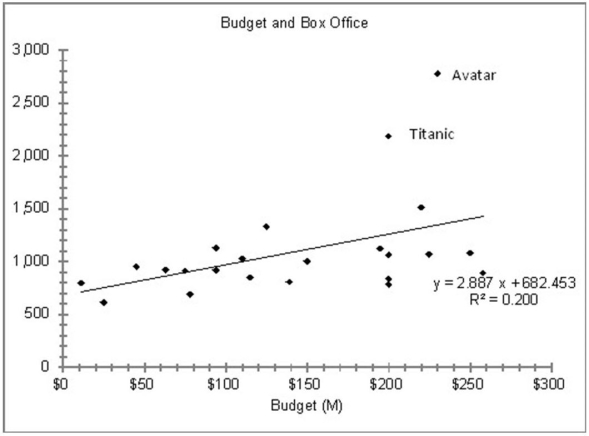
 -A new movie is in the making which has a budget of $350 million. What would the equation in the scatter diagram predict for its box office receipts?
(Multiple Choice)
4.9/5 (33)
Consider the following to answer the question(s) below:
Consider the following scatter diagram for 24 of the top grossing movies of all time. The data include the highest grossing films for which world box office receipts and budgets were available. The top two were Avatar and Titanic.
-A new movie is in the making which has a budget of $350 million. Using the equation in the scatter diagram to predict sales we can say
(Multiple Choice)
4.8/5 (37)
After transforming data, a model of retail sales of furniture and fixtures in Canada on value of building permits yielded the following equation: log10 (Sales) = 2.33 + 0.57 log10 (Value of permits)
What is the predicted value of retail sales if the value of building permits is $700,000?
(Multiple Choice)
4.8/5 (29)
Quarterly sales figures for e-commerce retail sales were obtained from the first quarter of 2009 through the fourth quarter of 2015. A regression model was estimated to describe the trend in e-commerce retail sales over time.
a. Based on the plot of residuals versus predicted values, is the linear model appropriate? Explain. 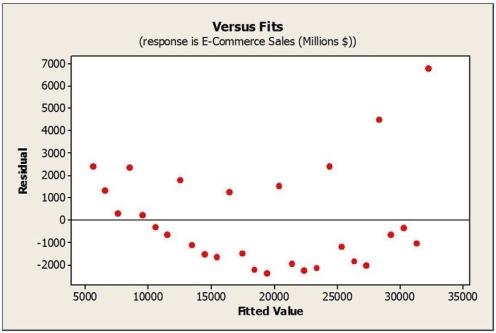 b. The Durbin-Watson statistic for this regression model was found to be 1.727. What can you conclude from this statistic at the 0.01 level of significance?
(Essay)
4.9/5 (31)
Consider the following to answer the question(s) below:
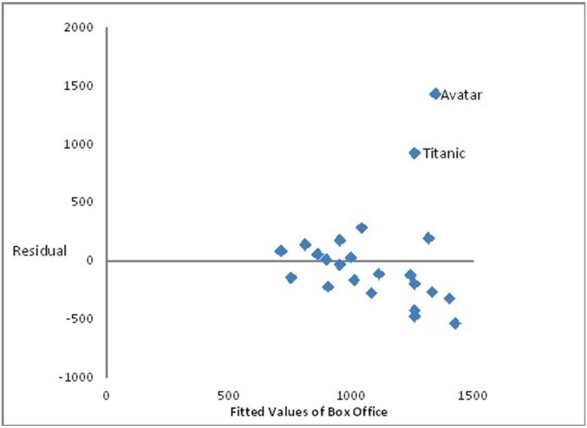
Consider the following scatter diagram for 24 of the top grossing movies of all time. The data include the highest grossing films for which world box office receipts and budgets were available. The top two were Avatar and Titanic.
-The best practice for modelling this data set given the scatter plot would be
(Multiple Choice)
4.8/5 (39)
Consider the following to answer the question(s) below:
Monthly closing stock prices for a utility company were obtained from January 2014 through August 2015. A regression model was estimated to describe the trend in closing stock prices over time. 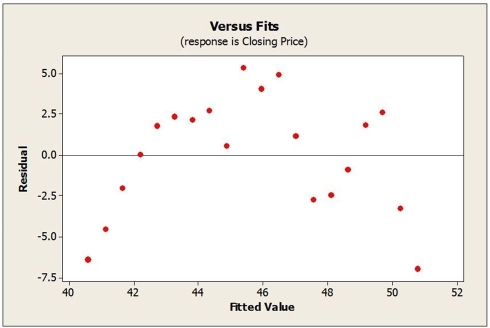 -Which of the following statement is true about autocorrelation?
(Multiple Choice)
4.7/5 (43)
Consider the following to answer the question(s) below:
Consider the following scatter diagram for 24 of the top grossing movies of all time. The data include the highest grossing films for which world box office receipts and budgets were available. The top two were Avatar and Titanic.
-What does the plot of the residuals and the fitted values suggest?
(Multiple Choice)
4.7/5 (37)
Filters
- Essay(0)
- Multiple Choice(0)
- Short Answer(0)
- True False(0)
- Matching(0)