Exam 15: Design of Experiments and Analysis of Variance Anova
Exam 2: Data30 Questions
Exam 3: Surveys and Sampling28 Questions
Exam 4: Displaying and Describing Categorical Data32 Questions
Exam 5: Displaying and Describing Quantitative Data32 Questions
Exam 6: Scatterplots, Association, and Correlation32 Questions
Exam 7: Introduction to Linear Regression32 Questions
Exam 8: Randomness and Probability32 Questions
Exam 9: Random Variables and Probability Distributions28 Questions
Exam 10: Sampling Distributions28 Questions
Exam 11: Confidence Intervals for Proportions32 Questions
Exam 12: Testing Hypotheses About Proportions36 Questions
Exam 13: Confidence Intervals and Hypothesis Tests for Means36 Questions
Exam 14: Comparing Two Means32 Questions
Exam 15: Design of Experiments and Analysis of Variance Anova24 Questions
Exam 16: Inference for Counts: Chi-Square Tests26 Questions
Exam 17: Nonparametric Methods26 Questions
Exam 18: Inference for Regression32 Questions
Exam 19: Understanding Regression Residuals28 Questions
Exam 20: Multiple Regression22 Questions
Exam 21: Building Multiple Regression Models22 Questions
Exam 22: Time Series Analysis28 Questions
Exam 23: Decision Making and Risk32 Questions
Exam 24: Quality Control28 Questions
Exam 25: Exploring and Collecting Data32 Questions
Exam 26: Understanding Probability Distributions and Statistical Inference73 Questions
Exam 27: Exploring Relationships Among Variables40 Questions
Exam 28: Using Statistics for Decision Making26 Questions
Select questions type
Consider the following to answer the question(s) below:
An Internet service provider is interested in testing to see if there is a difference in the mean weekly connect time for users who come into the service through a dial-up line, DSL, or cable Internet. To test this, the ISP has selected random samples from each category of users and recorded the connect time during a week period. The following is partial Excel output for the data. 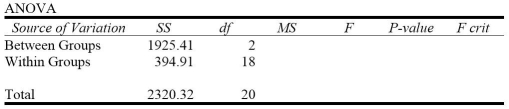 -The P-value for this statistic is < 0.001. Therefore, at α = 0.05
(Multiple Choice)
4.8/5  (38)
(38)
Consider the following to answer the question(s):
An advocacy group is interested in determining if gender (1 = Female, 2 = Male) affects executive level salaries. They take a random sample of executives in three different industries: (1 = Consumer Goods, 2 = Financial, 3 = Health Care). Salary data are collected. The two-way ANOVA results appear below. 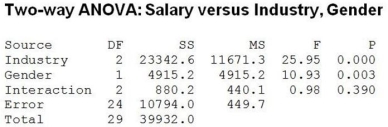 -Which of the following statements is true?
(Multiple Choice)
4.9/5 (38)
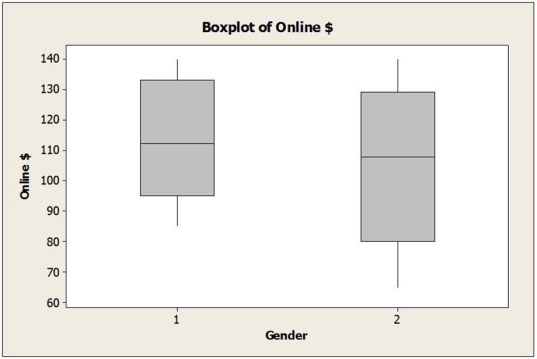
A survey of online consumers asked respondents to indicate how much money they spent for online purchases during the most recent Christmas holiday season. These data were analyzed to see if gender (1= Female; 2 = Male) and income level (1 = Low, 2 = Middle, 3 = High) influence the amount consumers spend online for holiday shopping. The two-way ANOVA results appear below. 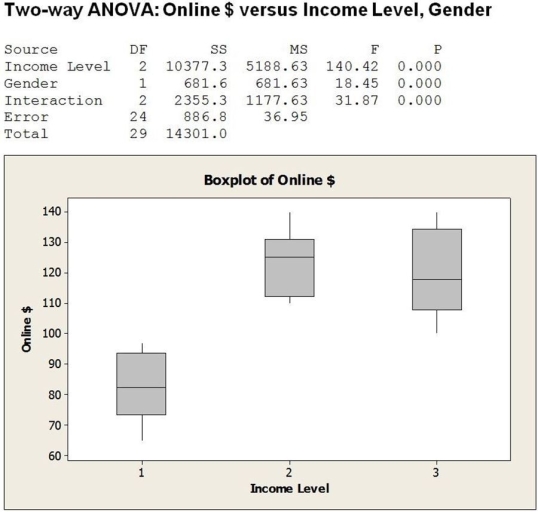
 a. Is this an experiment or observational study?
b. Are the conditions for two-way ANOVA met?
c. If so, perform the hypothesis tests and state your conclusions in terms of amount spent online, gender and income level.
d. Is it appropriate to interpret the main effects in this case separately? Explain.
a. Is this an experiment or observational study?
b. Are the conditions for two-way ANOVA met?
c. If so, perform the hypothesis tests and state your conclusions in terms of amount spent online, gender and income level.
d. Is it appropriate to interpret the main effects in this case separately? Explain.
(Essay)
4.8/5 (28)
Consider the following to answer the question(s) below:
Management styles differ among organizations and may potentially affect employee job satisfaction. A sample of employees was randomly selected from each of three companies with different management styles (Authoritarian, Laissez-faire and Participative) and asked to rate their level of job satisfaction on a 10-point scale (10 being the highest level of satisfaction). The data collected and partial ANOVA results appear below.
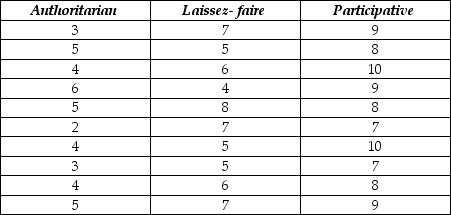
 -The P-value for this statistic turns out to be < 0.001. Therefore, at α = 0.05
(Multiple Choice)
4.8/5 (34)
Filters
- Essay(0)
- Multiple Choice(0)
- Short Answer(0)
- True False(0)
- Matching(0)