Exam 6: Scatterplots, Association, and Correlation
Exam 2: Data30 Questions
Exam 3: Surveys and Sampling28 Questions
Exam 4: Displaying and Describing Categorical Data32 Questions
Exam 5: Displaying and Describing Quantitative Data32 Questions
Exam 6: Scatterplots, Association, and Correlation32 Questions
Exam 7: Introduction to Linear Regression32 Questions
Exam 8: Randomness and Probability32 Questions
Exam 9: Random Variables and Probability Distributions28 Questions
Exam 10: Sampling Distributions28 Questions
Exam 11: Confidence Intervals for Proportions32 Questions
Exam 12: Testing Hypotheses About Proportions36 Questions
Exam 13: Confidence Intervals and Hypothesis Tests for Means36 Questions
Exam 14: Comparing Two Means32 Questions
Exam 15: Design of Experiments and Analysis of Variance Anova24 Questions
Exam 16: Inference for Counts: Chi-Square Tests26 Questions
Exam 17: Nonparametric Methods26 Questions
Exam 18: Inference for Regression32 Questions
Exam 19: Understanding Regression Residuals28 Questions
Exam 20: Multiple Regression22 Questions
Exam 21: Building Multiple Regression Models22 Questions
Exam 22: Time Series Analysis28 Questions
Exam 23: Decision Making and Risk32 Questions
Exam 24: Quality Control28 Questions
Exam 25: Exploring and Collecting Data32 Questions
Exam 26: Understanding Probability Distributions and Statistical Inference73 Questions
Exam 27: Exploring Relationships Among Variables40 Questions
Exam 28: Using Statistics for Decision Making26 Questions
Select questions type
Consider the following to answer the question(s) below:
A consumer research group investigating the relationship between the price of meat (per kilogram) and the fat content (grams) gathered data that produced the following scatterplot. 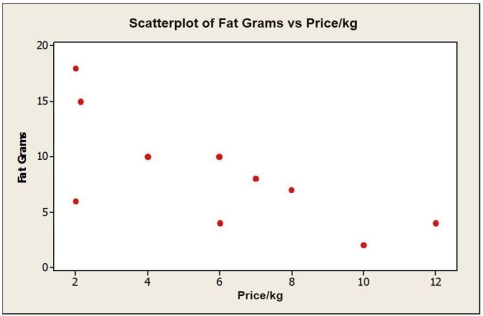 -Which of the following statements is correct?
(Multiple Choice)
4.8/5  (33)
(33)
Consider the following to answer the question(s) below:
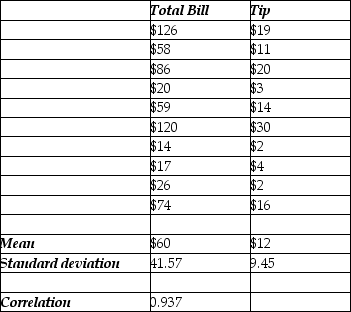
To determine whether the tip left at the end of a meal is related to the size of the total bill at their restaurant, Chez Michelle, data were gathered for 10 customers. The data and summary statistics are shown below.
 -In commenting on the increase in home foreclosures, a news reporter stated "there appears to be a strong correlation between home foreclosures and job loss of the head of household." Comment on this statement.
(Essay)
4.8/5 (30)
Consider the following to answer the question(s) below:
To determine whether the tip left at the end of a meal is related to the size of the total bill at their restaurant, Chez Michelle, data were gathered for 10 customers. The data and summary statistics are shown below.
-The following scatterplot shows monthly sales figures (in units) and number of months of experience on the job for a sample of 18 salespeople. 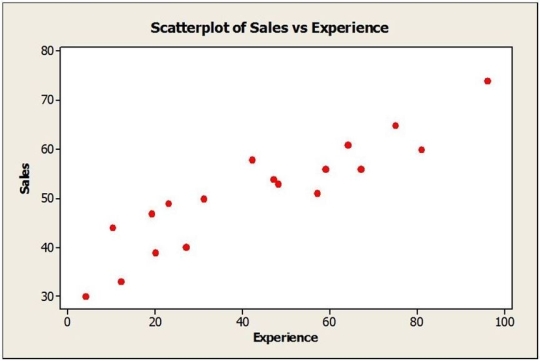 a. Describe the association between monthly sales and level of experience.
b. Do these data satisfy the conditions for computing a correlation coefficient? Explain.
c. Estimate the correlation. Which value of r looks most probable: 0.1, 0.3, or 0.9?
a. Describe the association between monthly sales and level of experience.
b. Do these data satisfy the conditions for computing a correlation coefficient? Explain.
c. Estimate the correlation. Which value of r looks most probable: 0.1, 0.3, or 0.9?
(Essay)
4.9/5 (35)
Consider the following to answer the question(s) below:
A consumer research group investigating the relationship between the price of meat (per kilogram) and the fat content (grams) gathered data that produced the following scatterplot.
-Which of the following statements about the relationship associated with the given scatterplot is true? 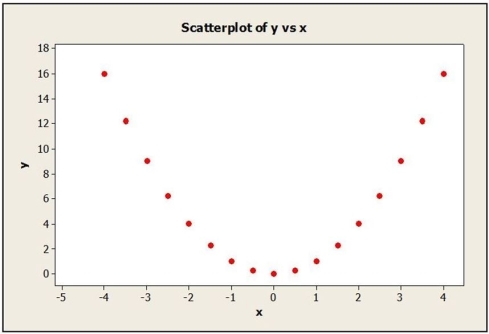
(Multiple Choice)
4.8/5 (43)
Consider the following to answer the question(s) below:
A consumer research group investigating the relationship between the price of meat (per kilogram) and the fat content (grams) gathered data that produced the following scatterplot.
-A perfect correlation between two variables will always produce which of the following?
(Multiple Choice)
4.9/5 (40)
Consider the following to answer the question(s) below:
The following scatterplot shows monthly sales figures (in units) and the number of months of experience on the job for a sample of 18 salespeople. 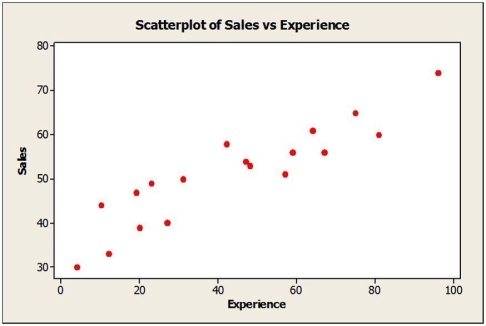 -The correlation coefficient between monthly sales and number of months of experience is most likely
(Multiple Choice)
4.8/5 (48)
Consider the following to answer the question(s) below:
To determine whether the tip left at the end of a meal is related to the size of the total bill at their restaurant, Chez Michelle, data were gathered for 10 customers. The data and summary statistics are shown below.
-A consumer research group investigating the relationship between the price of meat (per kilogram) and the fat content (grams) gathered data that produced the following scatterplot. 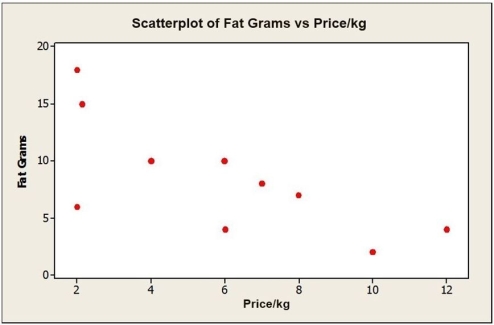 a. Describe the association between the price of meat and fat content.
b. Estimate the correlation. Which value of r looks most probable: -0.9, -0.5, or -0.1?
c. If the point in the lower left hand corner ($2.00 per kilogram, 6 grams of fat) is removed, would the correlation become stronger, weaker, or remain the same? Explain.
a. Describe the association between the price of meat and fat content.
b. Estimate the correlation. Which value of r looks most probable: -0.9, -0.5, or -0.1?
c. If the point in the lower left hand corner ($2.00 per kilogram, 6 grams of fat) is removed, would the correlation become stronger, weaker, or remain the same? Explain.
(Essay)
4.9/5 (29)
Consider the following to answer the question(s) below:
To determine whether the tip left at the end of a meal is related to the size of the total bill at their restaurant, Chez Michelle, data were gathered for 10 customers. The data and summary statistics are shown below.
-For each of the following scenarios, indicate which is the predictor variable and which is the response variable.
a. A study examined consumption levels of oil and carbon dioxide emissions for a sample of municipalities.
b. Data were collected on job performance rating and hours of training for a sample of employees at a telecommunications repair facility.
c. Salary data as well as years of managerial experience were collected for a sample of executives in the high tech industry.
(Essay)
4.8/5 (34)
Consider the following to answer the question(s) below:
A consumer research group investigating the relationship between the price of meat (per kilogram) and the fat content (grams) gathered data that produced the following scatterplot.
-In a university statistics course a correlation coefficient of -0.8 was found between the number of classes missed and the course grade. This can be interpreted to mean that
(Multiple Choice)
4.9/5 (22)
Consider the following to answer the question(s) below:
To determine whether the tip left at the end of a meal is related to the size of the total bill at their restaurant, Chez Michelle, data were gathered for 10 customers. The data and summary statistics are shown below.
-The following scatterplot shows a relationship between x and y that results in a correlation coefficient of r = 0. Explain why r = 0 in this situation even though there appears to be a strong relationship between the x and y variables. 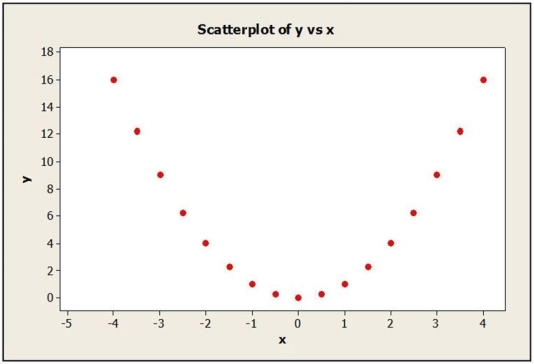
(Essay)
4.8/5 (47)
Consider the following to answer the question(s) below:
To determine whether the tip left at the end of a meal is related to the size of the total bill at their restaurant, Chez Michelle, data were gathered for 10 customers. The data and summary statistics are shown below.
-Government sponsored research investigated the relationship between the number of hours individuals spend on the Internet and age. Which of the following statements is true?
(Multiple Choice)
4.8/5 (29)
Consider the following to answer the question(s) below:
To determine whether the tip left at the end of a meal is related to the size of the total bill at their restaurant, Chez Michelle, data were gathered for 10 customers. The data and summary statistics are shown below.
-Based on the scatterplots shown below, describe the association between x and y.
a. 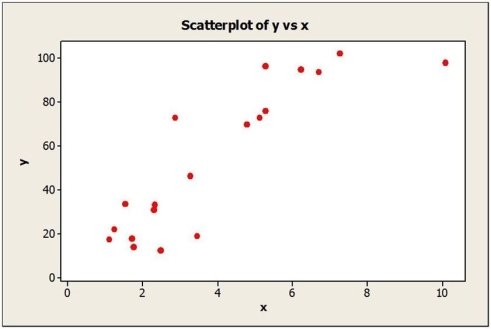 b.
b. 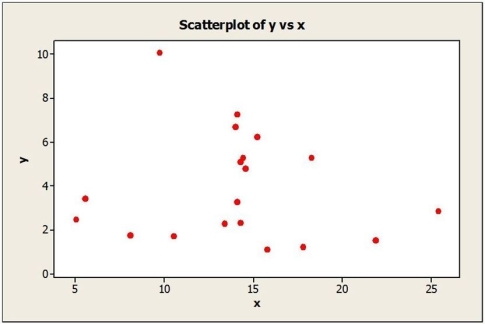
(Essay)
4.9/5 (32)
Filters
- Essay(0)
- Multiple Choice(0)
- Short Answer(0)
- True False(0)
- Matching(0)