Exam 10: Parametric Equations and Polar Coordinates
Exam 1: Preliminaries143 Questions
Exam 2: Limits and Continuity125 Questions
Exam 3: Differentiation150 Questions
Exam 4: Applications of the Derivative143 Questions
Exam 5: Integration154 Questions
Exam 6: Applications of the Definite Integral113 Questions
Exam 7: Integration Techniques95 Questions
Exam 8: First-Order Differential Equations72 Questions
Exam 9: Infinite Series111 Questions
Exam 10: Parametric Equations and Polar Coordinates129 Questions
Exam 11: Vectors and the Geometry of Space107 Questions
Exam 12: Vector-Valued Functions103 Questions
Exam 13: Functions of Several Variables and Partial Differentiation112 Questions
Exam 14: Multiple Integrals92 Questions
Exam 15: Vector Calculus67 Questions
Exam 16: Second Order Differential Equations38 Questions
Select questions type
At time t = 0 seconds, a hockey puck is headed towards the "board" (the wall around the perimeter of the area of play) as shown in the figure (the view is from above the playing surface). At that same instant, a hockey player at a different position on the ice is headed straight up the ice in order to intercept the puck (see figure). The trajectories of the puck and the player are described by the following set of parametric equations: ![At time t = 0 seconds, a hockey puck is headed towards the board (the wall around the perimeter of the area of play) as shown in the figure (the view is from above the playing surface). At that same instant, a hockey player at a different position on the ice is headed straight up the ice in order to intercept the puck (see figure). The trajectories of the puck and the player are described by the following set of parametric equations: Find the location(s) of intersection of the trajectories of the player and the puck. Distances are in feet and time is in seconds. [figure is not necessarily drawn to scale]](https://storage.examlex.com/TB2342/11eaa948_ccc4_cb4a_84bc_d7ab93c7c34c_TB2342_00.jpg) Find the location(s) of intersection of the trajectories of the player and the puck. Distances are in feet and time is in seconds.
Find the location(s) of intersection of the trajectories of the player and the puck. Distances are in feet and time is in seconds. ![At time t = 0 seconds, a hockey puck is headed towards the board (the wall around the perimeter of the area of play) as shown in the figure (the view is from above the playing surface). At that same instant, a hockey player at a different position on the ice is headed straight up the ice in order to intercept the puck (see figure). The trajectories of the puck and the player are described by the following set of parametric equations: Find the location(s) of intersection of the trajectories of the player and the puck. Distances are in feet and time is in seconds. [figure is not necessarily drawn to scale]](https://storage.examlex.com/TB2342/11eaa948_ccc4_cb4b_84bc_5b148c2d512d_TB2342_00.jpg) [figure is not necessarily drawn to scale]
[figure is not necessarily drawn to scale]
(Multiple Choice)
4.8/5  (33)
(33)
Identify a range of values of  that produces one copy of the graph.
(Multiple Choice)
4.9/5 (45)
Sketch the graph of the polar equation. (Find a corresponding x-y equation if it helps.) 
(Multiple Choice)
4.7/5 (36)
A medical procedure called shockwave lithotripsy is used to break up kidney stones that are too large or irregular to be passed. In this procedure, shockwaves emanating from a transducer located at the other focus. Suppose that the reflector is described by the equation  (in units of inches), how far from the kidney stone should the transducer be placed?
(Multiple Choice)
4.9/5 (42)
Graph the conic section with focus  and the given directrix and eccentricity. Directrix

(Multiple Choice)
4.8/5 (43)
Find the rectangular representation of the given polar point. 
(Multiple Choice)
4.9/5 (44)
Sketch the graph of the polar equation. (Find a corresponding x-y equation if it helps.) 
(Multiple Choice)
4.8/5 (33)
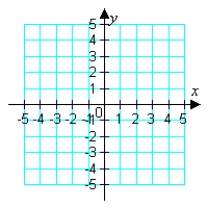
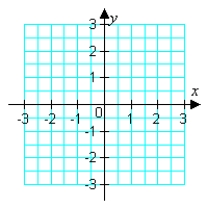
Which graph below corresponds to the given parametric equations? 
(Multiple Choice)
4.8/5 (38)
Find a polar equation for the conic section with focus  and the given directrix and eccentricity. Directrix

(Multiple Choice)
4.9/5 (41)
Find the rectangular representation of the given polar point. 
(Multiple Choice)
4.8/5 (33)
Sketch the graph of the polar equation. (Find a corresponding x-y equation if it helps.) r = 2 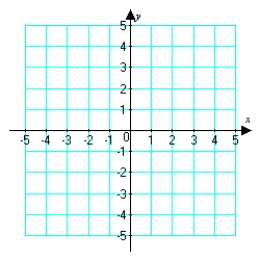
(Multiple Choice)
4.7/5 (32)
Find the slope of the tangent line to the given curve at the indicated point. 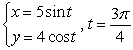
(Multiple Choice)
4.7/5 (41)
Find the vertices, foci, and directrices of the given hyperbola. 
(Multiple Choice)
4.8/5 (41)
Use a CAS or graphing calculator to sketch the plane curve defined by the given parametric equations. Use a window size of [-5, 5] by [-5, 5]. ![Use a CAS or graphing calculator to sketch the plane curve defined by the given parametric equations. Use a window size of [-5, 5] by [-5, 5].](https://storage.examlex.com/TB2342/11eaa948_ccc0_5f3a_84bc_0f70281ec97d_TB2342_00.jpg)
(Multiple Choice)
4.9/5 (35)
Which graph below corresponds to the given parametric equations? 
(Multiple Choice)
4.9/5 (34)
Filters
- Essay(0)
- Multiple Choice(0)
- Short Answer(0)
- True False(0)
- Matching(0)