Exam 2: Describing Data: Frequency Tables, Frequency Distributions, and Graphic Presentation
Exam 1: What Is Statistics79 Questions
Exam 2: Describing Data: Frequency Tables, Frequency Distributions, and Graphic Presentation129 Questions
Exam 3: Describing Data: Numerical Measures117 Questions
Exam 4: Describing Data: Displaying and Exploring Data92 Questions
Exam 5: A Survey of Probability Concepts121 Questions
Exam 6: Discrete Probability Distributions114 Questions
Exam 7: Continuous Probability Distributions100 Questions
Exam 8: Sampling Methods and the Central Limit Theorem114 Questions
Exam 9: Estimation and Confidence Intervals114 Questions
Exam 10: One-Sample Tests of Hypothesis129 Questions
Exam 11: Two-Sample Tests of Hypothesis122 Questions
Exam 12: Analysis of Variance92 Questions
Exam 13: Correlation and Linear Regression130 Questions
Exam 14: Multiple Regression Analysis122 Questions
Exam 15: Nonparametric Methods: Goodness-Of-Fit Tests128 Questions
Select questions type
A class relative frequency represents a __________ of the total observations in the class.
(Short Answer)
4.9/5  (33)
(33)
Ages (rounded to the nearest whole year) of employees at a large company were grouped into a distribution with the following class limits:
20 up to 30
30 up to 40
40 up to 50
50 up to 60
60 up to 70
What is the midpoint for the class 40 up to 50?
(Short Answer)
4.9/5 (41)
A student was studying the political party preferences of a university's student population. The survey instrument asked students to identify their political preference, for example, Democrat, Republican, Libertarian, or another party. The best way to illustrate the frequencies for each political preference is a __________.
(Multiple Choice)
4.9/5 (43)
Refer to the following wage breakdown for a garment factory. 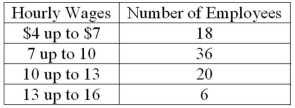 What is the class interval for the preceding table of wages?
(Multiple Choice)
4.9/5 (34)
The midpoint of a class, which is also called a class mark, is halfway between the lower and upper limits.
(True/False)
4.9/5 (32)
The first three class marks for a frequency distribution of "weights of college men" recorded to the nearest pound are 105, 115, and 125.
What is the lower limit for the third class?
(Short Answer)
4.7/5 (23)
Ages (rounded to the nearest whole year) of employees at a large company were grouped into a distribution with the following class limits:
20 up to 30
30 up to 40
40 up to 50
50 up to 60
60 up to 70
What is the class interval?
(Short Answer)
4.9/5 (39)
The number of employees less than the upper limit of each class at Lloyd's Fast Food Emporium is shown in the following table: 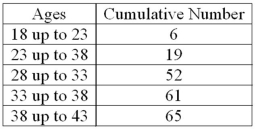 What is it called?
(Multiple Choice)
4.9/5 (34)
The first three class marks for a frequency distribution of "weights of college men" recorded to the nearest pound are 105, 115, and 125.
What is the upper limit for the third class?
(Short Answer)
4.8/5 (33)
Refer to the following breakdown of responses to a survey of "How confident are you that you saved enough to retire?" 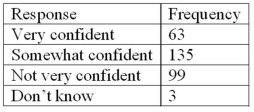 What is the class interval for the preceding frequency table?
(Multiple Choice)
4.9/5 (32)
Refer to the following breakdown of responses to a survey of room cleanliness in a hotel. 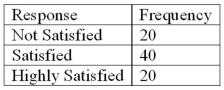 Draw a pie chart that illustrates the relative frequencies.
(Essay)
4.8/5 (31)
The following frequency distribution shows the distribution of delivery times (in days) for swimstuff.com customer orders during the last month. 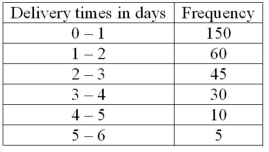 What is the relative frequency of the orders delivered from 1 day up to 3 days?
(Short Answer)
4.8/5 (36)
Refer to the following wage breakdown for a garment factory. 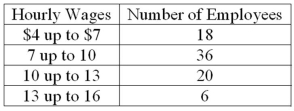 What are the class limits for the class with the smallest frequencies?
(Multiple Choice)
4.8/5 (30)
A frequency polygon is a very useful graphic technique when comparing two or more distributions.
(True/False)
4.7/5 (28)
A data set has 200 observations. In the data, a qualitative variable's highest value is "extremely satisfied" and its lowest value is "extremely dissatisfied." What is the minimum class interval that you would recommend?
(Essay)
4.9/5 (37)
The suggested class interval for a frequency distribution with data ranges from 100 to 220 with 50 observations would be _______.
(Short Answer)
4.8/5 (40)
Refer to the following distribution of commissions: 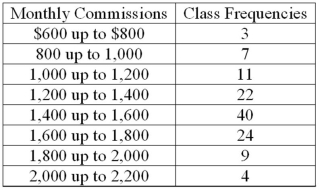 What is the relative frequency of those salespersons that earn $1,600 or more?
(Multiple Choice)
5.0/5 (37)
Refer to the following frequency distribution on days absent during a calendar year by employees of a manufacturing company: 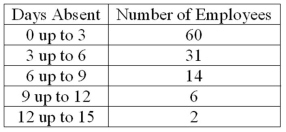 How many employees were absent between 3 up to 6 days?
(Multiple Choice)
4.9/5 (27)
Filters
- Essay(0)
- Multiple Choice(0)
- Short Answer(0)
- True False(0)
- Matching(0)