Exam 2: Describing Data: Frequency Tables, Frequency Distributions, and Graphic Presentation
Exam 1: What Is Statistics79 Questions
Exam 2: Describing Data: Frequency Tables, Frequency Distributions, and Graphic Presentation129 Questions
Exam 3: Describing Data: Numerical Measures117 Questions
Exam 4: Describing Data: Displaying and Exploring Data92 Questions
Exam 5: A Survey of Probability Concepts121 Questions
Exam 6: Discrete Probability Distributions114 Questions
Exam 7: Continuous Probability Distributions100 Questions
Exam 8: Sampling Methods and the Central Limit Theorem114 Questions
Exam 9: Estimation and Confidence Intervals114 Questions
Exam 10: One-Sample Tests of Hypothesis129 Questions
Exam 11: Two-Sample Tests of Hypothesis122 Questions
Exam 12: Analysis of Variance92 Questions
Exam 13: Correlation and Linear Regression130 Questions
Exam 14: Multiple Regression Analysis122 Questions
Exam 15: Nonparametric Methods: Goodness-Of-Fit Tests128 Questions
Select questions type
Refer to the following distribution of commissions: 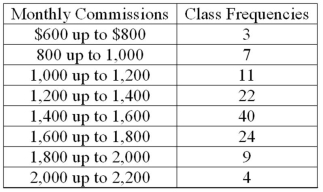 What is the class interval?
(Multiple Choice)
4.8/5  (35)
(35)
In a bar chart, why are there spaces between the bars on the horizontal axis?
(Essay)
4.9/5 (37)
To construct a pie chart, relative class frequencies are used to graph the "slices" of the pie.
(True/False)
4.8/5 (27)
Refer to the following distribution of ages: 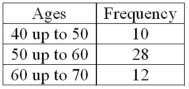 For the distribution of ages just shown, what is the relative class frequency for the lowest class?
(Multiple Choice)
4.9/5 (25)
Refer to the following breakdown of responses to a survey of room service in a hotel. 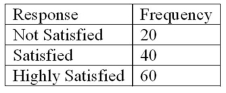 What percent of the responses indicated that customers were satisfied?
(Multiple Choice)
4.8/5 (39)
When a class interval is expressed as 100 up to 200, _________________________.
(Multiple Choice)
4.8/5 (33)
The midpoint of a class interval is also called a class ________.
(Short Answer)
4.9/5 (36)
Refer to the following breakdown of responses to a survey of room service in a hotel. 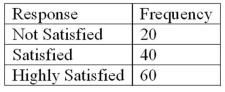 What is the class with the greatest frequency?
(Multiple Choice)
4.8/5 (37)
The following frequency distribution shows the distribution of delivery times (in days) for swimstuff.com customer orders during the last month. 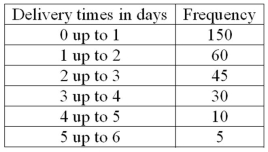 What is the relative frequency for orders delivered in three days or more?
(Short Answer)
4.8/5 (31)
Refer to the following distribution: 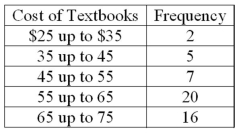 What is the class midpoint for the $45 up to $55 class?
(Multiple Choice)
5.0/5 (38)
A table showing the number of observations that have been grouped into each of several classes is called a frequency ________________.
(Short Answer)
4.9/5 (35)
A ___________ is useful for displaying the relative frequency distribution for a nominal variable.
(Short Answer)
4.8/5 (28)
The following frequency distribution shows the distribution of delivery times (in days) for swimstuff.com customer orders during the last month. 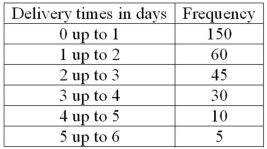 How many orders were delivered in less than one day?
(Short Answer)
4.8/5 (40)
In a frequency distribution, a class defined as "Under $100" and "$1,000 and over" is called a(n) ____________.
(Short Answer)
4.8/5 (36)
To construct a bar chart, the class frequencies are plotted on the _________.
(Short Answer)
4.8/5 (35)
A cumulative frequency distribution is used when we want to determine how many observations lie above or below certain values.
(True/False)
4.8/5 (28)
A frequency distribution groups data into classes showing the number of observations in each class.
(True/False)
4.9/5 (32)
Refer to the following breakdown of responses to a survey of "Are you concerned about being tracked while connected to the Internet?" 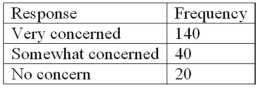 What type of chart should be used to describe the frequency table?
(Multiple Choice)
4.8/5 (39)
Refer to the following breakdown of responses to a survey of room service in a hotel. 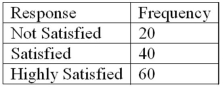 What is the class interval for the frequency table above?
(Multiple Choice)
4.8/5 (28)
Filters
- Essay(0)
- Multiple Choice(0)
- Short Answer(0)
- True False(0)
- Matching(0)