Exam 2: Describing Data: Frequency Tables, Frequency Distributions, and Graphic Presentation
Exam 1: What Is Statistics79 Questions
Exam 2: Describing Data: Frequency Tables, Frequency Distributions, and Graphic Presentation129 Questions
Exam 3: Describing Data: Numerical Measures117 Questions
Exam 4: Describing Data: Displaying and Exploring Data92 Questions
Exam 5: A Survey of Probability Concepts121 Questions
Exam 6: Discrete Probability Distributions114 Questions
Exam 7: Continuous Probability Distributions100 Questions
Exam 8: Sampling Methods and the Central Limit Theorem114 Questions
Exam 9: Estimation and Confidence Intervals114 Questions
Exam 10: One-Sample Tests of Hypothesis129 Questions
Exam 11: Two-Sample Tests of Hypothesis122 Questions
Exam 12: Analysis of Variance92 Questions
Exam 13: Correlation and Linear Regression130 Questions
Exam 14: Multiple Regression Analysis122 Questions
Exam 15: Nonparametric Methods: Goodness-Of-Fit Tests128 Questions
Select questions type
Refer to the following frequency distribution on days absent during a calendar year by employees of a manufacturing company: 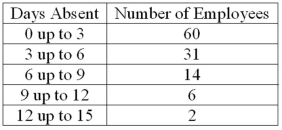 How many employees were absent from 6 up to 12 days?
(Multiple Choice)
4.8/5  (33)
(33)
The following frequency distribution shows the distribution of delivery times (in days) for swimstuff.com customer orders during the last month. 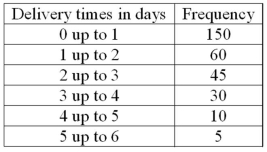 How many orders were delivered from 1 day up to 3 days?
(Short Answer)
4.9/5 (46)
Refer to the following breakdown of responses to a survey of "How confident are you that you saved enough to retire?" 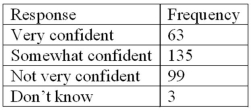 What percent of the responses indicated that users were very confident?
(Multiple Choice)
4.8/5 (33)
Refer to the following distribution: 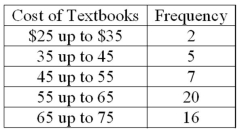 What are the class limits for class with the highest frequency?
(Multiple Choice)
4.8/5 (27)
A ______ chart is useful for displaying a relative frequency distribution.
(Short Answer)
4.7/5 (35)
In a deck of cards, a class of all cards that are hearts and a class of all cards that are kings are NOT _____________.
(Short Answer)
4.7/5 (37)
The following frequency distribution shows the distribution of delivery times (in days) for swimstuff.com customer orders during the last month. 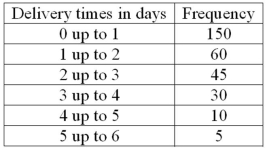 What is the relative frequency for orders delivered in less than one day?
(Short Answer)
4.8/5 (36)
A student was interested in the cigarette smoking habits of college students and collected data from an unbiased random sample of students. The data is summarized in the following table: 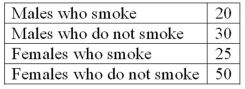 What type of chart best represents relative class frequencies?
(Multiple Choice)
4.8/5 (32)
A student was studying the political party preferences of a university's student population. The survey instrument asked students to identify their political preference-for example, Democrat, Republican, Libertarian, or another party. The best way to illustrate the relative frequency distribution is a __________.
(Multiple Choice)
4.8/5 (35)
Filters
- Essay(0)
- Multiple Choice(0)
- Short Answer(0)
- True False(0)
- Matching(0)