Exam 2: Describing Data: Frequency Tables, Frequency Distributions, and Graphic Presentation
Exam 1: What Is Statistics79 Questions
Exam 2: Describing Data: Frequency Tables, Frequency Distributions, and Graphic Presentation129 Questions
Exam 3: Describing Data: Numerical Measures117 Questions
Exam 4: Describing Data: Displaying and Exploring Data92 Questions
Exam 5: A Survey of Probability Concepts121 Questions
Exam 6: Discrete Probability Distributions114 Questions
Exam 7: Continuous Probability Distributions100 Questions
Exam 8: Sampling Methods and the Central Limit Theorem114 Questions
Exam 9: Estimation and Confidence Intervals114 Questions
Exam 10: One-Sample Tests of Hypothesis129 Questions
Exam 11: Two-Sample Tests of Hypothesis122 Questions
Exam 12: Analysis of Variance92 Questions
Exam 13: Correlation and Linear Regression130 Questions
Exam 14: Multiple Regression Analysis122 Questions
Exam 15: Nonparametric Methods: Goodness-Of-Fit Tests128 Questions
Select questions type
In a relative frequency distribution, the sum of the relative class frequencies is _____________________.
(Short Answer)
4.9/5  (30)
(30)
Refer to the following information from a frequency distribution for "heights of college women" recorded to the nearest inch: the first two class midpoints are 62.5" and 65.5". What is the class interval?
(Multiple Choice)
5.0/5 (35)
Refer to the following distribution: 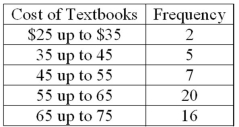 What is the relative class frequency for the $25 up to $35 class?
(Multiple Choice)
4.7/5 (39)
To convert a frequency distribution to a relative frequency distribution, divide each class frequency by the number of classes.
(True/False)
4.7/5 (38)
For a frequency distribution of qualitative data, if the observations can be assigned to only one class, the classes are __________________________.
(Short Answer)
4.9/5 (31)
Refer to the following frequency distribution on days absent during a calendar year by employees of a manufacturing company: 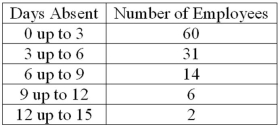 How many employees were absent six days or more?
(Multiple Choice)
4.9/5 (34)
To construct a histogram, the class frequencies are plotted on the ________.
(Short Answer)
4.7/5 (35)
Why are unequal class intervals sometimes used in a frequency distribution?
(Multiple Choice)
4.8/5 (48)
The first three class marks for a frequency distribution of "weights of college men" recorded to the nearest pound are 105, 115, and 125.
What is the class interval?
(Short Answer)
4.8/5 (29)
When data is collected using a qualitative, nominal variable, what is true about a frequency distribution that summarizes the data?
(Multiple Choice)
4.8/5 (28)
Refer to the following breakdown of responses to a survey of room service in a hotel. 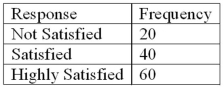 What type of chart should be used to describe the frequency table?
(Multiple Choice)
4.9/5 (35)
Refer to the following distribution of commissions: 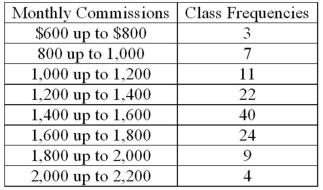 What is the relative frequency for those salespersons that earn from $1,600 up to $1,800?
(Multiple Choice)
4.8/5 (30)
A frequency distribution for nominal data requires that the categories be ___________________ and _____________________.
(Short Answer)
4.9/5 (28)
The following frequency distribution shows the distribution of delivery times (in days) for swimstuff.com customer orders during the last month. 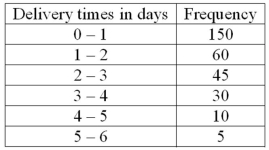 For 300 observations, our rule-of-thumb for number of classes would indicate 9 classes. In this case, what is the class interval and why would it be reasonable to use that class interval and only 6 classes?
(Essay)
4.9/5 (32)
Refer to the following breakdown of responses to a survey of "Are you concerned about being tracked while connected to the Internet?" 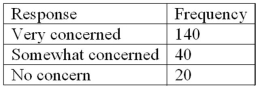 What percent of the responses indicated that users were somewhat concerned?
(Multiple Choice)
4.8/5 (39)
In a cumulative frequency distribution, the percent of the total frequencies that would fall below the upper limit of the highest class would be _________.
(Short Answer)
4.9/5 (27)
The following frequency distribution shows the distribution of delivery times (in days) for swimstuff.com customer orders during the last month. 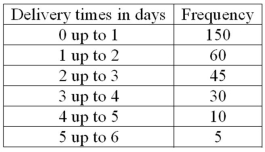 What is the relative frequency for orders delivered in less than three days?
(Short Answer)
4.8/5 (38)
Ages (rounded to the nearest whole year) of employees at a large company were grouped into a distribution with the following class limits:
20 up to 30
30 up to 40
40 up to 50
50 up to 60
60 up to 70
The class limits for the class 50 up to 60 are _______ and ______.
(Short Answer)
4.7/5 (34)
Monthly commissions of first-year insurance brokers are $1,270, $1,310, $1,680, $1,380, $1,410, $1,570, $1,180 and $1,420. These figures are referred to as a(n) __________.
(Multiple Choice)
4.7/5 (34)
Filters
- Essay(0)
- Multiple Choice(0)
- Short Answer(0)
- True False(0)
- Matching(0)