Exam 2: Describing Data: Frequency Tables, Frequency Distributions, and Graphic Presentation
Exam 1: What Is Statistics79 Questions
Exam 2: Describing Data: Frequency Tables, Frequency Distributions, and Graphic Presentation129 Questions
Exam 3: Describing Data: Numerical Measures117 Questions
Exam 4: Describing Data: Displaying and Exploring Data92 Questions
Exam 5: A Survey of Probability Concepts121 Questions
Exam 6: Discrete Probability Distributions114 Questions
Exam 7: Continuous Probability Distributions100 Questions
Exam 8: Sampling Methods and the Central Limit Theorem114 Questions
Exam 9: Estimation and Confidence Intervals114 Questions
Exam 10: One-Sample Tests of Hypothesis129 Questions
Exam 11: Two-Sample Tests of Hypothesis122 Questions
Exam 12: Analysis of Variance92 Questions
Exam 13: Correlation and Linear Regression130 Questions
Exam 14: Multiple Regression Analysis122 Questions
Exam 15: Nonparametric Methods: Goodness-Of-Fit Tests128 Questions
Select questions type
The following frequency distribution shows the distribution of delivery times (in days) for swimstuff.com customer orders during the last month. 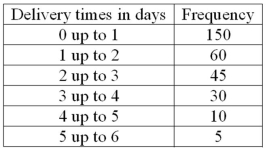 How many orders were delivered in less than three days?
(Short Answer)
4.8/5  (35)
(35)
Refer to the following breakdown of responses to a survey of "Are you concerned about being tracked while connected to the Internet?" 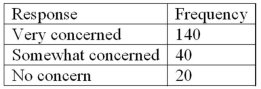 What is the class interval for the preceding frequency table?
(Multiple Choice)
4.9/5 (33)
If the number of observations is 124, calculate the suggested number of classes using the "2 to the k rule."
(Short Answer)
4.7/5 (30)
A student was studying the political party preferences of a university's student population. The survey instrument asked students to identify themselves as a Democrat or a Republican. This question is flawed because:
(Multiple Choice)
4.8/5 (32)
A class interval, or class width, can be determined by subtracting the lower limit of a class from the lower limit of the next higher class.
(True/False)
5.0/5 (36)
The relative frequency for a class represents the ________________.
(Multiple Choice)
4.8/5 (24)
A data set has 100 observations. In the data, a quantitative variable's highest value is 117 and its lowest value is 47. What is the minimum class interval that you would recommend?
(Essay)
4.8/5 (36)
Refer to the following breakdown of responses to a survey of "How confident are you that you saved enough to retire?" 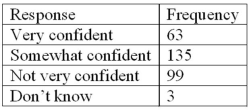 What type of chart should be used to describe the frequency table?
(Multiple Choice)
4.9/5 (32)
Refer to the following breakdown of responses to a survey of "How confident are you that you saved enough to retire?"  What type of chart should be used to show relative class frequencies?
(Multiple Choice)
4.8/5 (35)
The monthly salaries of a sample of 100 employees were rounded to the nearest $10. They ranged from a low of $1,040 to a high of $1,720. If we want to condense the data into seven classes, what is the most convenient class interval?
(Multiple Choice)
4.9/5 (38)
A student was interested in the cigarette smoking habits of college students and collected data from an unbiased random sample of students. The data is summarized in the following table: 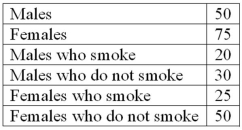 Why is the table NOT a frequency distribution?
(Multiple Choice)
4.8/5 (18)
Refer to the following wage breakdown for a garment factory. 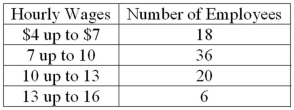 What is the class midpoint for the class with the greatest frequency?
(Multiple Choice)
4.8/5 (36)
To calculate a relative frequency, a class frequency is divided by ___________.
(Short Answer)
4.9/5 (40)
For a relative frequency distribution, relative frequency is computed as _____________.
(Multiple Choice)
4.9/5 (36)
Refer to the following breakdown of responses to a survey of room cleanliness in a hotel. 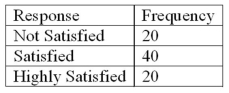 Draw a bar graph that illustrates the preceding frequency table.
(Essay)
4.8/5 (31)
The first three class marks for a frequency distribution of "weights of college men" recorded to the nearest pound are 105, 115, and 125.
What are the class limits for the fourth class?
(Short Answer)
4.7/5 (33)
For the following distribution of heights, what are the limits for the class with the greatest frequency? 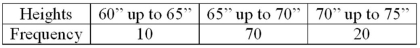
(Multiple Choice)
4.7/5 (30)
Refer to the following distribution of commissions: 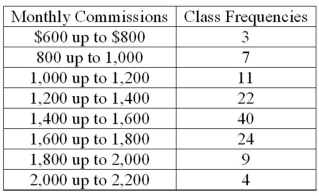 To plot a cumulative frequency distribution, the first coordinate would be _________.
(Multiple Choice)
4.8/5 (37)
Refer to the following breakdown of responses to a survey of room service in a hotel. 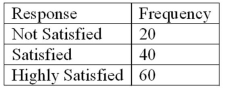 What type of chart should be used to show relative class frequencies?
(Multiple Choice)
4.9/5 (35)
In frequency distributions, classes are mutually exclusive if each individual, object, or measurement is included in only one category.
(True/False)
4.9/5 (36)
Filters
- Essay(0)
- Multiple Choice(0)
- Short Answer(0)
- True False(0)
- Matching(0)