Exam 2: Describing Data: Frequency Tables, Frequency Distributions, and Graphic Presentation
Exam 1: What Is Statistics79 Questions
Exam 2: Describing Data: Frequency Tables, Frequency Distributions, and Graphic Presentation129 Questions
Exam 3: Describing Data: Numerical Measures117 Questions
Exam 4: Describing Data: Displaying and Exploring Data92 Questions
Exam 5: A Survey of Probability Concepts121 Questions
Exam 6: Discrete Probability Distributions114 Questions
Exam 7: Continuous Probability Distributions100 Questions
Exam 8: Sampling Methods and the Central Limit Theorem114 Questions
Exam 9: Estimation and Confidence Intervals114 Questions
Exam 10: One-Sample Tests of Hypothesis129 Questions
Exam 11: Two-Sample Tests of Hypothesis122 Questions
Exam 12: Analysis of Variance92 Questions
Exam 13: Correlation and Linear Regression130 Questions
Exam 14: Multiple Regression Analysis122 Questions
Exam 15: Nonparametric Methods: Goodness-Of-Fit Tests128 Questions
Select questions type
Refer to the following breakdown of responses to a survey of room cleanliness in a hotel. 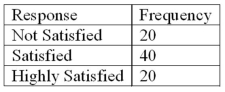 What is the class interval for the following frequency table?
(Essay)
4.7/5  (36)
(36)
A data set consists of 40 observations. For a quantitative variable, how many classes would you recommend for the frequency distribution?
(Short Answer)
4.7/5 (44)
Refer to the following distribution of ages: 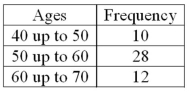 What is the class midpoint of the highest class?
(Multiple Choice)
4.7/5 (33)
To convert a frequency distribution to a relative frequency distribution, divide each class frequency by the sum of the class frequencies.
(True/False)
4.8/5 (27)
In constructing a frequency polygon, class frequencies are scaled on the ______ axis.
(Short Answer)
4.9/5 (34)
A sample distribution of hourly earnings in Paul's Cookie Factory is: 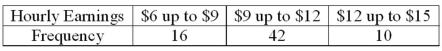 The limits of the class with the smallest frequency are:
(Multiple Choice)
4.8/5 (43)
A group of 100 students were surveyed about their interest in a new Economics major. Interest was measured in terms of high, medium, or low. In the study, 30 students responded high interest, 50 students responded medium interest, and 20 students responded low interest. What is the best way to illustrate the relative frequency of student interest?
(Multiple Choice)
4.8/5 (33)
A data set has 200 observations. In the data, a quantitative variable's highest value is 1080 and its lowest value is 960. What is the minimum class interval that you would recommend?
(Essay)
4.9/5 (25)
A _____ chart is useful for displaying a frequency distribution for a nominal variable.
(Short Answer)
4.8/5 (35)
In a bar chart, the heights of the bars represent the frequencies in each class.
(True/False)
4.7/5 (36)
Refer to the following distribution of ages: 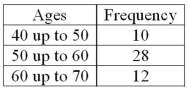 What is the class interval?
(Multiple Choice)
4.9/5 (36)
Refer to the following breakdown of responses to a survey of "How confident are you that you saved enough to retire?" 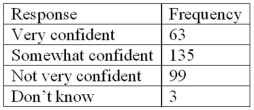 What is the class with the greatest frequency?
(Multiple Choice)
4.9/5 (31)
Refer to the following breakdown of responses to a survey of room cleanliness in a hotel. 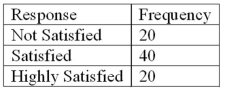 Draw a bar graph that illustrates the relative frequencies.
(Essay)
4.9/5 (33)
The following frequency distribution shows the distribution of delivery times (in days) for swimstuff.com customer orders during the last month. 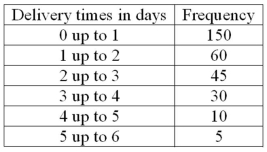 How many orders were delivered in three days or more?
(Short Answer)
4.9/5 (39)
The number of observations in each class of a frequency distribution is called a ________________________.
(Short Answer)
4.8/5 (34)
When data is collected using a quantitative, ratio variable, what is true about a frequency distribution that summarizes the data?
(Multiple Choice)
4.8/5 (32)
To summarize the gender of students attending a college in a frequency distribution, a total of at least ______ classes would be required.
(Short Answer)
4.8/5 (39)
Filters
- Essay(0)
- Multiple Choice(0)
- Short Answer(0)
- True False(0)
- Matching(0)