Exam 14: Glm 3: Factorial Designs
Exam 1: Why Is My Evil Lecturer Forcing Me to Learn Statistics9 Questions
Exam 2: The Spine of Statistics25 Questions
Exam 3: The Phoenix of Statistics16 Questions
Exam 4: The Ibm Spss Statistics Environment25 Questions
Exam 5: Exploring Data With Graphs12 Questions
Exam 6: The Beast of Bias23 Questions
Exam 7: Non-Parametric Models20 Questions
Exam 8: Correlation23 Questions
Exam 9: The Linear Model Regression20 Questions
Exam 10: Comparing Two Means25 Questions
Exam 11: Moderation, Mediation and Multicategory Predictors16 Questions
Exam 12: Glm 1: Comparing Several Independent Means22 Questions
Exam 13: Glm 2: Comparing Means Adjusted for Other Predictors Analysis of Covariance25 Questions
Exam 14: Glm 3: Factorial Designs25 Questions
Exam 15: Glm 4: Repeated-Measures Designs24 Questions
Exam 16: Glm 5: Mixed Designs17 Questions
Exam 17: Multivariate Analysis of Variance Manova19 Questions
Exam 18: Exploratory Factor Analysis22 Questions
Exam 19: Categorical Outcomes: Chi-Square and Loglinear Analysis24 Questions
Exam 20: Categorical Outcomes: Logistic Regression24 Questions
Exam 21: Multilevel Linear Models9 Questions
Select questions type
Using the data in the table below, what value should appear where there is a Y? 
Free
(Multiple Choice)
4.8/5  (32)
(32)
Correct Answer: Verified
B
Using the data in the table below, indicate what value should appear where X appears? 
Free
(Multiple Choice)
4.8/5 (33)
Correct Answer:Verified
A
An experiment was performed in which participants were given lists to learn in either quiet or noisy environments. On later recall either congruous or non-congruous cues for recall were given and recall was either in the same or different context of learning. What design is this experiment?
Free
(Multiple Choice)
4.9/5 (34)
Correct Answer:Verified
A
An experiment was done to look at the positive arousing effects of imagery on different people. A sample of statistics lecturers was compared against a group of students. Both groups received presentations of positive images (e.g., cats and bunnies), neutral images (e.g., duvets and light bulbs), and negative images (e.g., corpses and vivisection photographs). Positive arousal was measured physiologically (high values indicate positive arousal) both before and after each batch of images. The order in which participants saw the batches of positive, neutral and negative images was randomized to avoid order effects. It was hypothesized that positive images would increase positive arousal, negative images would reduce positive arousal and neutral images would have no effect. Differences between the subject groups (lecturers and students) were not expected. What technique should be used to analyse these data?
(Multiple Choice)
4.8/5 (35)
Factorial ANOVA for the maintenance sector is reported as F(2.24) = 19.186, p < 0.05. What does this indicate?
(Multiple Choice)
4.8/5 (37)
The histogram shown below relates to a study undertaken by Baker et al. (2003) of the impact of roster changes on absenteeism and incident frequency in an Australian coal mine. The average monthly absenteeism rates in the three specific work areas examined, according to collection period. The authors state that 'there was a trend for increased rates during the second (3.11%) and third (3.72%) collection periods within the CPP sector, compared to the first (1.87%), F(2,24) = 2.441, p > 0.05.' What does this result explain? 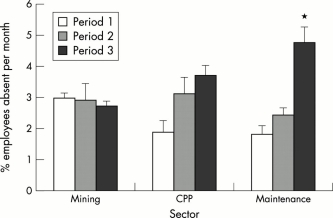
(Multiple Choice)
4.9/5 (38)
Using the data in the table below, what is the outcome of this analysis? 
(Multiple Choice)
4.8/5 (34)
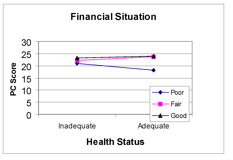
A study undertaken by an unknown author in 2000 investigated 'factors influencing sense of personal control among elderly rural women' . What does the interaction in the graph show in terms of personal control and health status? 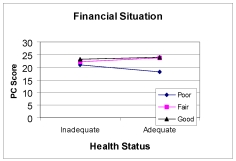
(Multiple Choice)
4.8/5 (37)
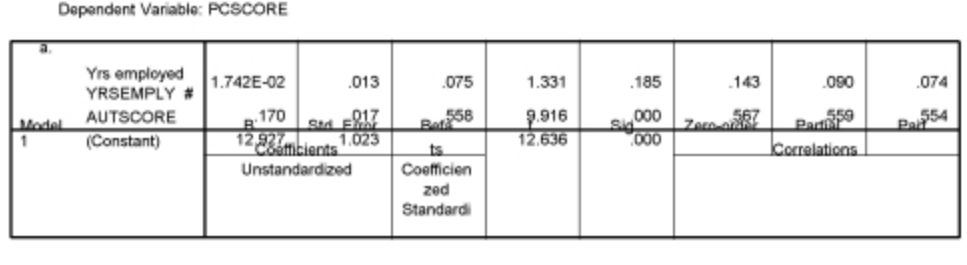
A study undertaken by an unknown author in 2000, looked at 'Investigating Factors Influencing Sense of Personal Control Among Elderly Rural Women'.What does the following table suggest, where AUTSCORE relates to autonomy and personal control?
(Multiple Choice)
4.9/5 (37)
Which of the following is not a question answered by two-way ANOVAs?
(Multiple Choice)
4.9/5 (33)
A study undertaken by an unknown author in 2000 investigated 'factors influencing sense of personal control among elderly rural women' .If there was an interaction evident, what further test could be performed? 
(Multiple Choice)
4.9/5 (45)
In a factorial design with two factors, if the effect of one factor appears to depend on the levels of the second factor, this is called
(Multiple Choice)
4.8/5 (33)
Using the data in the table below, what would be the psychological interpretation of the analysis? 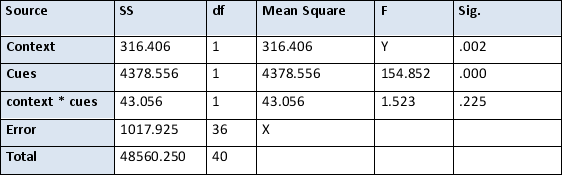
(Multiple Choice)
4.8/5 (33)
If a study has employed a two-way mixed ANOVA, what does this mean?
(Multiple Choice)
4.7/5 (35)
Which procedure is not suitable for interpreting interaction effects statistically?
(Multiple Choice)
5.0/5 (31)
Which of the following is a key feature of factorial ANOVA?
(Multiple Choice)
4.9/5 (33)
Filters
- Essay(0)
- Multiple Choice(0)
- Short Answer(0)
- True False(0)
- Matching(0)