Exam 13: Glm 2: Comparing Means Adjusted for Other Predictors Analysis of Covariance
Exam 1: Why Is My Evil Lecturer Forcing Me to Learn Statistics9 Questions
Exam 2: The Spine of Statistics25 Questions
Exam 3: The Phoenix of Statistics16 Questions
Exam 4: The Ibm Spss Statistics Environment25 Questions
Exam 5: Exploring Data With Graphs12 Questions
Exam 6: The Beast of Bias23 Questions
Exam 7: Non-Parametric Models20 Questions
Exam 8: Correlation23 Questions
Exam 9: The Linear Model Regression20 Questions
Exam 10: Comparing Two Means25 Questions
Exam 11: Moderation, Mediation and Multicategory Predictors16 Questions
Exam 12: Glm 1: Comparing Several Independent Means22 Questions
Exam 13: Glm 2: Comparing Means Adjusted for Other Predictors Analysis of Covariance25 Questions
Exam 14: Glm 3: Factorial Designs25 Questions
Exam 15: Glm 4: Repeated-Measures Designs24 Questions
Exam 16: Glm 5: Mixed Designs17 Questions
Exam 17: Multivariate Analysis of Variance Manova19 Questions
Exam 18: Exploratory Factor Analysis22 Questions
Exam 19: Categorical Outcomes: Chi-Square and Loglinear Analysis24 Questions
Exam 20: Categorical Outcomes: Logistic Regression24 Questions
Exam 21: Multilevel Linear Models9 Questions
Select questions type
Which of the following is not considered to be an assumption of ANCOVA?
Free
(Multiple Choice)
4.7/5  (29)
(29)
Correct Answer: Verified
C
A music teacher had noticed that some students went to pieces during exams. He wanted to test whether this performance anxiety was different for people playing different instruments. He took groups of guitarists, drummers and pianists (variable = 'Instru') and measured their anxiety (variable = 'Anxiety') during the exam. He also noted the type of exam they were performing (in the UK, musical instrument exams are known as 'grades' and range from 1 to 8). He wanted to see whether the type of instrument played affected performance anxiety when controlling for the grade of the exam. What analysis should he use?
Free
(Multiple Choice)
4.8/5 (32)
Correct Answer:Verified
A
Consider the graph below. This is the graph of the results of an experimental learning condition as the independent variable and IQ as the covariate. What does the graph indicate? 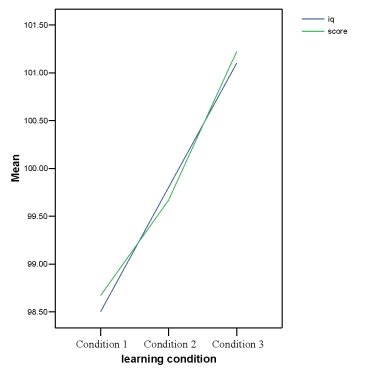
Free
(Multiple Choice)
4.7/5 (27)
Correct Answer:Verified
A
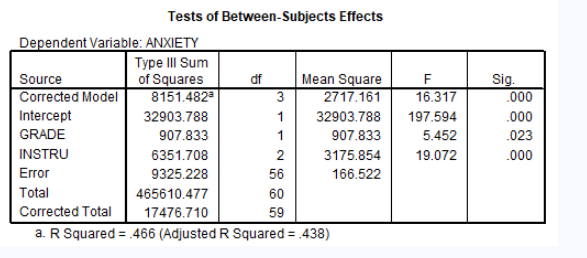
A music teacher had noticed that some students went to pieces during exams. He wanted to test whether this performance anxiety was different for people playing different instruments. He took groups of guitarists, drummers and pianists (variable = 'Instru') and measured their anxiety (variable = 'Anxiety') during the exam. He also noted the type of exam they were performing (in the UK, musical instrument exams are known as 'grades' and range from 1 to 8). He wanted to see whether the type of instrument played affected performance anxiety when controlling for the grade of the exam. The first part of the SPSS output is below. What does this part of the output tell us? 
(Multiple Choice)
5.0/5 (32)
The following scatterplot represents the results of a study undertaken by Chakrabarty et al. (2005) who were investigating glutamate levels in psychotropic drug-naive OCD patients and comparing them with psychiatrically normal controls. Based on this scatterplot the following ANCOVA of glutamate levels in CSF was done. Findings were reported as follows for CSF glutamate levels in OCD patients compared to controls: F(1,29)=11.153, p=0.002. What conclusion can be drawn about this result?  Scatterplot showing CSF glutamate levels in patients (1) and controls (2).
ANCOVA of Glutamate Levels in CSF
Scatterplot showing CSF glutamate levels in patients (1) and controls (2).
ANCOVA of Glutamate Levels in CSF
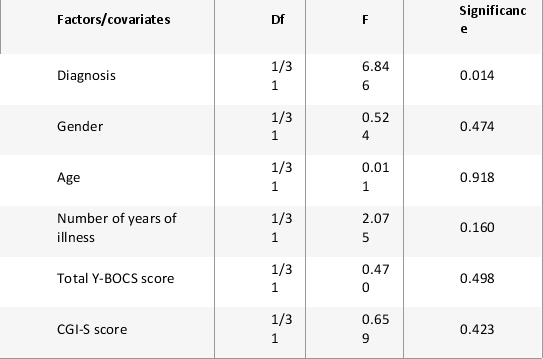 Diagnosis (OCD vs Controls) and gender were included as factors, while age, number of years of illness, total Y-BOCS scores, and CGI-S scores were included as covariates in the analysis.
(Multiple Choice)
4.9/5 (40)
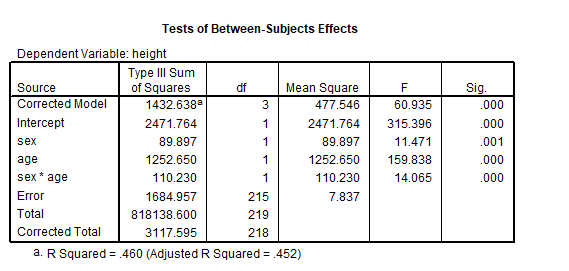
A scatterplot and a summary table for the ANCOVA on the data relating to it are given below. What does the interaction term suggest? 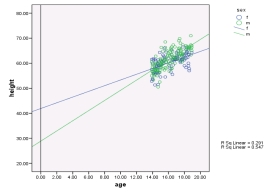
(Multiple Choice)
4.8/5 (36)
When assumptions are violated in ANCOVA, which non-parametric test can be carried out?
(Multiple Choice)
4.8/5 (38)
A health psychologist was interested in the effects of smoking on the suppression of the immune system. Three groups of adults were exposed (in a highly ethical way) to either a cold virus, a flu virus or were left freezing wet in the outside in the middle of winter to catch pneumonia (no more than smokers deserve!). The severity of the disease was then measured as a percentage (0% = not contracted, 100% = contracted to a very severe degree). The psychologist also measured the number of cigarettes that each person smoked per day. The psychologist was interested in the differences in the severity of the three illnesses and the impact of cigarette usage. What technique should be used to analyse these data?
(Multiple Choice)
5.0/5 (35)
The following scatterplot represents the results of a study undertaken by Chakrabarty et al. (2005) who were investigating glutamate levels in psychotropic drug-naive OCD patients and comparing them with psychiatrically normal controls. Findings were reported as follows for CSF glutamate levels in OCD patients compared to controls: F(1,29)=11.153, p = 0.002. How would these findings be interpreted? 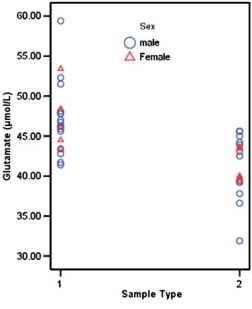 Scatterplot showing CSF glutamate levels in patients (1) and controls (2).
(Multiple Choice)
4.8/5 (37)
In an ANCOVA with one covariate and one independent variable, what null hypothesis is not tested?
(Multiple Choice)
4.8/5 (41)
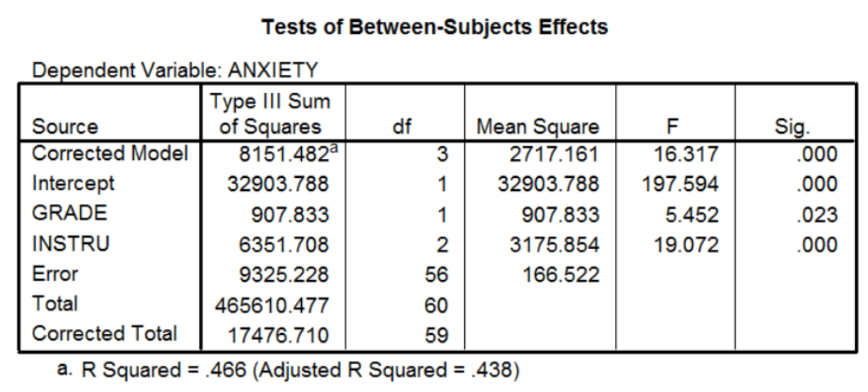
Using the SPSS output below, which of the following statements best reflects the effect of 'Grade'?
(Multiple Choice)
4.9/5 (31)
What is an alternative way to model the design of an ANCOVA?
(Multiple Choice)
4.8/5 (43)
A music teacher had noticed that some students went to pieces during exams. He wanted to test whether this performance anxiety was different for people playing different instruments. He took groups of guitarists, drummers and pianists (variable = 'Instru') and measured their anxiety (variable = 'Anxiety') during the exam. He also noted the type of exam they were performing (in the UK, musical instrument exams are known as 'grades' and range from 1 to 8). He wanted to see whether the type of instrument played affected performance anxiety when controlling for the grade of the exam. The second part of the SPSS output is below. Which of the following statements best reflects the effect of 'Instru'? 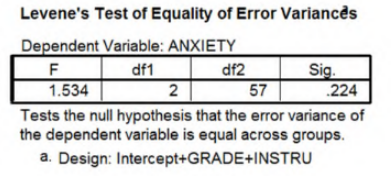
(Multiple Choice)
4.9/5 (31)
Filters
- Essay(0)
- Multiple Choice(0)
- Short Answer(0)
- True False(0)
- Matching(0)