Exam 10: Comparing Two Means
Exam 1: Why Is My Evil Lecturer Forcing Me to Learn Statistics26 Questions
Exam 2: The Spine of Statistics26 Questions
Exam 3: The Phoenix of Statistics16 Questions
Exam 4: The Ibm Spss Statistics Environment22 Questions
Exam 5: Exploring Data With Graphs21 Questions
Exam 6: The Beast of Bias25 Questions
Exam 7: Non-Parametric Models47 Questions
Exam 8: Correlation25 Questions
Exam 9: The Linear Model Regression23 Questions
Exam 10: Comparing Two Means24 Questions
Exam 11: Moderation, Mediation and Multicategory Predictors24 Questions
Exam 12: Glm 1: Comparing Several Independent Means46 Questions
Exam 13: Glm 2: Comparing Means Adjusted for Other Predictors Analysis of Covariance24 Questions
Exam 14: Glm 3: Factorial Designs21 Questions
Exam 15: Glm 4: Repeated-Measures Designs24 Questions
Exam 16: Glm 5: Mixed Designs22 Questions
Exam 17: Multivariate Analysis of Variance Manova25 Questions
Exam 18: Exploratory Factor Analysis25 Questions
Exam 19: Categorical Outcomes: Chi-Square and Loglinear Analysis24 Questions
Exam 20: Categorical Outcomes: Logistic Regression25 Questions
Exam 21: Multilevel Linear Models23 Questions
Select questions type
Examine the following SPSS output from the heart rate data. Based on 11 degrees of freedom, working to a two-tailed significance value of .05, the critical value for t is 2.201. What can you assume from the output? (The significance value has been omitted on purpose.) 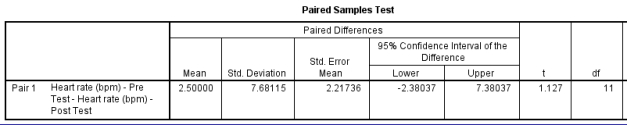
Free
(Multiple Choice)
4.9/5  (36)
(36)
Correct Answer: Verified
A
Which of the following issues are likely to cause Type II error in the cancer survival data?
Free
(Multiple Choice)
4.8/5 (34)
Correct Answer:Verified
D
When analysing the cancer survival data, a p-value set at .05 or .01 is most likely to protect against which type of error?
Free
(Multiple Choice)
4.8/5 (40)
Correct Answer:Verified
A
When analysing the result of the paired samples t-test, the output presents the following box, but what do the results show you? 
(Multiple Choice)
4.9/5 (44)
Which of the following expressions best represents the degrees of freedom?
(Multiple Choice)
4.8/5 (45)
If a significance result of .000 is presented, how should this be reported?
(Multiple Choice)
4.7/5 (39)
When exploring the data before performing a t-test, how might you wish to present the data graphically? (You may select more than one option.)
(Multiple Choice)
4.8/5 (36)
Run an independent t-test on the data. A Levene's test result of p = .006 was obtained. What can we infer from this number?
(Multiple Choice)
4.9/5 (45)
Assume that for the research into stomach and lung cancer the significance value is set at p < .05 and an independent t-test yielded a significance value of p = .06. What should you do?
(Multiple Choice)
4.9/5 (34)
Suppose we wanted to apply a one-tailed test as opposed to a two-tailed test. How would we covert a significance of p = .284?
(Multiple Choice)
4.8/5 (44)
When comparing pre-competition arousal scores in novice and expert tennis players you find that the scores for the novice group are not normally distributed. What test should be run to see if arousal scores are statistically different?
(Multiple Choice)
4.8/5 (46)
According to Cohen, how might this effect size be interpreted?
(Multiple Choice)
4.8/5 (34)
Once you have the significance value of the t-test, it is beneficial to calculate the effect size. Cohen's d is a measure of effect size. How is it calculated?
(Multiple Choice)
4.8/5 (31)
Which of the following t-tests has a different research design?
(Multiple Choice)
4.8/5 (36)
How might you classify the measurement scale of the survival rate (days)?
(Multiple Choice)
4.8/5 (34)
Analyse the data below related to days survival following surgery from either stomach or lung cancer. What is the result of the Kolmogorov-Smirnov test for the patients who survived stomach cancer? 
(Multiple Choice)
4.8/5 (39)
How might you classify the measurement scale for the variable labelled as cancer?
(Multiple Choice)
4.8/5 (27)
Filters
- Essay(0)
- Multiple Choice(0)
- Short Answer(0)
- True False(0)
- Matching(0)