Exam 12: Simple Linear Regression
Exam 1: Data and Statistics84 Questions
Exam 2: Descriptive Statistics: Tabular and Graphical Presentations116 Questions
Exam 3: Descriptive Statistics: Numerical Measures130 Questions
Exam 4: Introduction to Probability127 Questions
Exam 5: Discrete Probability Distributions146 Questions
Exam 6: Continuous Probability Distributions138 Questions
Exam 7: Sampling and Sampling Distributions123 Questions
Exam 8: Interval Estimation111 Questions
Exam 9: Hypothesis Tests117 Questions
Exam 10: Comparisons Involving Means, Experimental Design, and Analysis of Variance184 Questions
Exam 11: Comparisons Involving Proportions and a Test of Independence117 Questions
Exam 12: Simple Linear Regression107 Questions
Exam 13: Multiple Regression111 Questions
Exam 14: Statistical Methods for Quality Control72 Questions
Exam 15: Time Series Analysis and Forecastng75 Questions
Select questions type
Exhibit 12-5
You are given the following information about y and x.
 -Refer to Exhibit 12-5. The least squares estimate of b1 (slope) equals
(Multiple Choice)
4.8/5  (38)
(38)
The interval estimate of the mean value of y for a given value of x is the
(Multiple Choice)
4.9/5 (35)
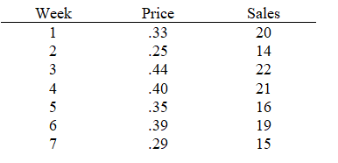
A company has recorded data on the weekly sales for its product (y) and the unit price of the competitor's product (x). The data resulting from a random sample of 7 weeks follows. Use Excel's Regression Tool to answer the following questions.
 a.What is the estimated regression equation?
b.Perform a t test and determine whether or not x and y are related. Use 0.05.
c.Perform an F test and determine whether or not x and y are related. Use 0.05.
d.Find and interpret the coefficient of determination.
a.What is the estimated regression equation?
b.Perform a t test and determine whether or not x and y are related. Use 0.05.
c.Perform an F test and determine whether or not x and y are related. Use 0.05.
d.Find and interpret the coefficient of determination.
(Essay)
4.7/5 (30)
In regression analysis, the variable that is being predicted is the
(Multiple Choice)
4.9/5 (32)
A company has recorded data on the weekly sales for its product (y) and the unit price of the competitor's product (x). The data resulting from a random sample of 7 weeks follows. Use Excel to:
a.compute a 95% confidence interval for expected sales for all weeks when the competitor's price is .30.
b.compute a 95% prediction interval for sales for a week when the competitor's price is 30.
(Essay)
4.9/5 (35)
Exhibit 12-1
A regression analysis resulted in the following information regarding a dependent variable (y) and an independent variable (x).
 -Refer to Exhibit 12-1. The sample correlation coefficient equals
(Multiple Choice)
4.9/5 (34)
If a data set has SST 2,000 and SSE 800, then the coefficient of determination is
(Multiple Choice)
4.9/5 (40)
Shown below is a portion of a computer output for regression analysis relating y (dependent variable) and x (independent variable).
 a.What has been the sample size for the above?
b.Perform a t-test and determine whether or not x and y are related. Use 0.05.
c.Perform an F-test and determine whether or not x and y are related. Use 0.05.
d. Compute the coefficient of determination.e. Interpret the meaning of the value of the coefficient of determination that you found in d. Be very specific.
a.What has been the sample size for the above?
b.Perform a t-test and determine whether or not x and y are related. Use 0.05.
c.Perform an F-test and determine whether or not x and y are related. Use 0.05.
d. Compute the coefficient of determination.e. Interpret the meaning of the value of the coefficient of determination that you found in d. Be very specific.
(Essay)
4.8/5 (28)
Exhibit 12-1
A regression analysis resulted in the following information regarding a dependent variable (y) and an independent variable (x).
-Refer to Exhibit 12-1. The least squares estimate of b0 equals
(Multiple Choice)
5.0/5 (31)
Exhibit 12-4
The following information regarding a dependent variable (Y) and an independent variable (X) is provided.
 SSE = 6
SST = 16
-Refer to Exhibit 12-4. The MSE is
SSE = 6
SST = 16
-Refer to Exhibit 12-4. The MSE is
(Multiple Choice)
4.8/5 (38)
Exhibit 12-4
The following information regarding a dependent variable (Y) and an independent variable (X) is provided.
SSE = 6
SST = 16
-Refer to Exhibit 12-4. The coefficient of determination is
(Multiple Choice)
4.9/5 (43)
Regression analysis was applied between sales (in $1,000) and advertising (in $100), and the following regression function was obtained.  80 6.2x Based on the above estimated regression line, if advertising is $10,000, then the point estimate for sales (in dollars) is
(Multiple Choice)
4.8/5 (31)
Exhibit 12-1
A regression analysis resulted in the following information regarding a dependent variable (y) and an independent variable (x).
-Refer to Exhibit 12-1. The point estimate of y when x 20 is
(Multiple Choice)
4.9/5 (40)
An observation that has a strong effect on the regression results is called a(n)
(Multiple Choice)
4.9/5 (32)
Exhibit 12-1
A regression analysis resulted in the following information regarding a dependent variable (y) and an independent variable (x).
-Refer to Exhibit 12-1. The least squares estimate of b1 equals
(Multiple Choice)
5.0/5 (28)
Filters
- Essay(0)
- Multiple Choice(0)
- Short Answer(0)
- True False(0)
- Matching(0)