Exam 12: Simple Linear Regression
Exam 1: Data and Statistics84 Questions
Exam 2: Descriptive Statistics: Tabular and Graphical Presentations116 Questions
Exam 3: Descriptive Statistics: Numerical Measures130 Questions
Exam 4: Introduction to Probability127 Questions
Exam 5: Discrete Probability Distributions146 Questions
Exam 6: Continuous Probability Distributions138 Questions
Exam 7: Sampling and Sampling Distributions123 Questions
Exam 8: Interval Estimation111 Questions
Exam 9: Hypothesis Tests117 Questions
Exam 10: Comparisons Involving Means, Experimental Design, and Analysis of Variance184 Questions
Exam 11: Comparisons Involving Proportions and a Test of Independence117 Questions
Exam 12: Simple Linear Regression107 Questions
Exam 13: Multiple Regression111 Questions
Exam 14: Statistical Methods for Quality Control72 Questions
Exam 15: Time Series Analysis and Forecastng75 Questions
Select questions type
Shown below is a portion of a computer output for regression analysis relating Y (dependent variable) and X (independent variable).
 a.What has been the sample size for the above?
b.Perform a t test and determine whether or not X and Y are related. Let = 0.05.
c.Perform an F test and determine whether or not X and Y are related. Let = 0.05.
d. Compute the coefficient of determination.e. Interpret the meaning of the value of the coefficient of determination that you found in d. Be very specific.
a.What has been the sample size for the above?
b.Perform a t test and determine whether or not X and Y are related. Let = 0.05.
c.Perform an F test and determine whether or not X and Y are related. Let = 0.05.
d. Compute the coefficient of determination.e. Interpret the meaning of the value of the coefficient of determination that you found in d. Be very specific.
(Essay)
4.8/5  (21)
(21)
Exhibit 12-6
You are given the following information about y and x.
 -Refer to Exhibit 12-6. The least squares estimate of b0 equals
(Multiple Choice)
4.8/5 (29)
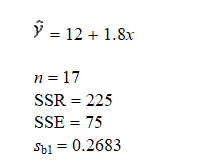
Exhibit 12-5
You are given the following information about y and x.
 -Refer to Exhibit 12-5. The coefficient of determination equals
(Multiple Choice)
4.7/5 (37)
Shown below is a portion of an Excel output for regression analysis relating Y (dependent variable) and X (independent variable).
 a.What has been the sample size for the above?
b.Perform a t test and determine whether or not X and Y are related. Let = 0.05.
c.Perform an F test and determine whether or not X and Y are related. Let = 0.05.
d. Compute the coefficient of determination.e. Interpret the meaning of the value of the coefficient of determination that you found in d. Be very specific.
a.What has been the sample size for the above?
b.Perform a t test and determine whether or not X and Y are related. Let = 0.05.
c.Perform an F test and determine whether or not X and Y are related. Let = 0.05.
d. Compute the coefficient of determination.e. Interpret the meaning of the value of the coefficient of determination that you found in d. Be very specific.
(Essay)
4.9/5 (40)
The following data represent the number of flash drives sold per day at a local computer shop and their prices.
 a.Perform an F test and determine if the price and the number of flash drives sold are related. Let = 0.01.
b.Perform a t test and determine if the price and the number of flash drives sold are related. Let = 0.01.
a.Perform an F test and determine if the price and the number of flash drives sold are related. Let = 0.01.
b.Perform a t test and determine if the price and the number of flash drives sold are related. Let = 0.01.
(Essay)
4.9/5 (30)
A procedure used for finding the equation of a straight line that provides the best approximation for the relationship between the independent and dependent variables is the
(Multiple Choice)
4.9/5 (32)
Shown below is a portion of a computer output for a regression analysis relating Y (demand) and X (unit price).
 a.Perform a t test and determine whether or not demand and unit price are related. Let = 0.05.
b.Perform an F test and determine whether or not demand and unit price are related. Let = 0.05.
c.Compute the coefficient of determination and fully interpret its meaning. Be very specific.
d.Compute the coefficient of correlation and explain the relationship between demand and unit price.
a.Perform a t test and determine whether or not demand and unit price are related. Let = 0.05.
b.Perform an F test and determine whether or not demand and unit price are related. Let = 0.05.
c.Compute the coefficient of determination and fully interpret its meaning. Be very specific.
d.Compute the coefficient of correlation and explain the relationship between demand and unit price.
(Essay)
5.0/5 (37)
Exhibit 12-3
Regression analysis was applied between sales data (in $1,000s) and advertising data (in $100s) and the following information was obtained.
 -Refer to Exhibit 12-3. The F statistic computed from the above data is
(Multiple Choice)
4.8/5 (37)
In simple linear regression analysis, which of the following is not true?
(Multiple Choice)
4.9/5 (33)
In regression analysis, which of the following is not a required assumption about the error term ?
(Multiple Choice)
4.9/5 (30)
In a simple regression analysis (where y is a dependent and x an independent variable), if the y intercept is positive, then
(Multiple Choice)
4.7/5 (27)
A data point (observation) that does not fit the trend shown by the remaining data is called a(n)
(Multiple Choice)
4.8/5 (26)
In a regression analysis if SST 4500 and SSE 1575, then the coefficient of determination is
(Multiple Choice)
4.9/5 (33)
Exhibit 12-2
You are given the following information about y and x.
 -Refer to Exhibit 12-2. The least squares estimate of b0 equals
(Multiple Choice)
4.8/5 (32)
Scott Bell Builders would like to predict the total number of labor hours spent framing a house based on the square footage of the house. The following data has been compiled on ten houses recently built.
 a. Develop the least-squares estimated regression equation that relates framing labor hours to house square footage.
b. Use the regression equation developed in part (a) to predict framing labor hours when the house size is 3350 square feet.
a. Develop the least-squares estimated regression equation that relates framing labor hours to house square footage.
b. Use the regression equation developed in part (a) to predict framing labor hours when the house size is 3350 square feet.
(Essay)
4.8/5 (38)
In a regression analysis if SSE 500 and SSR 300, then the coefficient of determination is
(Multiple Choice)
4.9/5 (44)
A regression analysis between sales (in $1000) and price (in dollars) resulted in the following equation  50,000 8x The above equation implies that an
(Multiple Choice)
4.8/5 (30)
Given below are seven observations collected in a regression study on two variables, x (independent variable) and y (dependent variable).
 a.Develop the least squares estimated regression equation.
b.At 95% confidence, perform a t test and determine whether or not the slope is significantly different from zero.
c.Perform an F test to determine whether or not the model is significant. Let 0.05.
d.Compute the coefficient of determination.
a.Develop the least squares estimated regression equation.
b.At 95% confidence, perform a t test and determine whether or not the slope is significantly different from zero.
c.Perform an F test to determine whether or not the model is significant. Let 0.05.
d.Compute the coefficient of determination.
(Essay)
4.7/5 (34)
If the coefficient of determination is a positive value, then the regression equation
(Multiple Choice)
4.8/5 (39)
Filters
- Essay(0)
- Multiple Choice(0)
- Short Answer(0)
- True False(0)
- Matching(0)