Exam 12: Simple Linear Regression
Exam 1: Data and Statistics84 Questions
Exam 2: Descriptive Statistics: Tabular and Graphical Presentations116 Questions
Exam 3: Descriptive Statistics: Numerical Measures130 Questions
Exam 4: Introduction to Probability127 Questions
Exam 5: Discrete Probability Distributions146 Questions
Exam 6: Continuous Probability Distributions138 Questions
Exam 7: Sampling and Sampling Distributions123 Questions
Exam 8: Interval Estimation111 Questions
Exam 9: Hypothesis Tests117 Questions
Exam 10: Comparisons Involving Means, Experimental Design, and Analysis of Variance184 Questions
Exam 11: Comparisons Involving Proportions and a Test of Independence117 Questions
Exam 12: Simple Linear Regression107 Questions
Exam 13: Multiple Regression111 Questions
Exam 14: Statistical Methods for Quality Control72 Questions
Exam 15: Time Series Analysis and Forecastng75 Questions
Select questions type
Given below are seven observations collected in a regression study on two variables, x (independent variable) and y (dependent variable). Use Excel's Regression Tool to construct a residual plot and use it to determine if any model assumption have been violated.

(Essay)
4.9/5  (30)
(30)
Exhibit 12-4
The following information regarding a dependent variable (Y) and an independent variable (X) is provided.
 SSE = 6
SST = 16
-Refer to Exhibit 12-4. The coefficient of correlation is
SSE = 6
SST = 16
-Refer to Exhibit 12-4. The coefficient of correlation is
(Multiple Choice)
4.9/5 (29)
Given below are seven observations collected in a regression study on two variables, x (independent variable) and y (dependent variable). Use Excel to develop a scatter diagram and to compute the least squares estimated regression equation and the coefficient of determination.

(Essay)
4.7/5 (35)
Regression analysis was applied between sales (in $1000) and advertising (in $100) and the following regression function was obtained.  500 + 4x Based on the above estimated regression line if advertising is $10,000, then the point estimate for sales (in dollars) is
(Multiple Choice)
4.8/5 (34)
Larger values of r2 imply that the observations are more closely grouped about the
(Multiple Choice)
5.0/5 (29)
Shown below is a portion of a computer output for a regression analysis relating Y (dependent variable) and X (independent variable).
 a.Perform a t test using the p-value approach and determine whether or not Y and X are related. Let = 0.05.
b.Using the p-value approach, perform an F test and determine whether or not X and Y are related.
c.Compute the coefficient of determination and fully interpret its meaning. Be very specific.
a.Perform a t test using the p-value approach and determine whether or not Y and X are related. Let = 0.05.
b.Using the p-value approach, perform an F test and determine whether or not X and Y are related.
c.Compute the coefficient of determination and fully interpret its meaning. Be very specific.
(Essay)
4.8/5 (40)
Exhibit 12-2
You are given the following information about y and x.
 -Refer to Exhibit 12-2. The least squares estimate of b1 equals
(Multiple Choice)
4.8/5 (30)
If two variables, x and y, have a strong linear relationship, then
(Multiple Choice)
4.8/5 (32)
Exhibit 12-3
Regression analysis was applied between sales data (in $1,000s) and advertising data (in $100s) and the following information was obtained.
 -Refer to Exhibit 12-3. Using 0.05, the critical t value for testing the significance of the slope is
(Multiple Choice)
4.8/5 (37)
Application of the least squares method results in values of the y intercept and the slope that minimizes the sum of the squared deviations between the
(Multiple Choice)
4.9/5 (39)
The proportion of the variation in the dependent variable y that is explained by the estimated regression equation is measured by the
(Multiple Choice)
5.0/5 (35)
In regression and correlation analysis, if SSE and SST are known, then with this information the
(Multiple Choice)
4.8/5 (42)
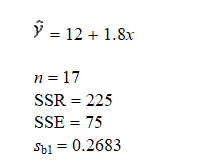
Exhibit 12-5
You are given the following information about y and x.
 -Refer to Exhibit 12-5. The least squares estimate of b0 (intercept)equals
(Multiple Choice)
4.8/5 (38)
As the goodness of fit for the estimated regression equation increases,
(Multiple Choice)
4.9/5 (38)
Exhibit 12-5
You are given the following information about y and x.
-Refer to Exhibit 12-5. The point estimate of y when x = 10 is
(Multiple Choice)
4.7/5 (38)
Exhibit 12-2
You are given the following information about y and x.
-Refer to Exhibit 12-2. The sample correlation coefficient equals
(Multiple Choice)
4.8/5 (37)
In regression analysis if the dependent variable is measured in dollars, the independent variable
(Multiple Choice)
4.8/5 (33)
Filters
- Essay(0)
- Multiple Choice(0)
- Short Answer(0)
- True False(0)
- Matching(0)