Exam 3: Describing Data Visually
Exam 1: Overview of Statistics50 Questions
Exam 2: Data Collection95 Questions
Exam 3: Describing Data Visually108 Questions
Exam 4: Descriptive Statistics134 Questions
Exam 5: Probability121 Questions
Exam 6: Discrete Probability Distributions127 Questions
Exam 7: Continuous Probability Distributions112 Questions
Exam 8: Sampling Distributions and Estimation99 Questions
Exam 9: One-Sample Hypothesis Tests136 Questions
Exam 10: Two-Sample Hypothesis Tests115 Questions
Exam 11: Analysis of Variance141 Questions
Exam 12: Simple Regression120 Questions
Exam 13: Multiple Regression111 Questions
Exam 14: Time-Series Analysis111 Questions
Exam 15: Chi-Square Tests94 Questions
Exam 16: Nonparametric Tests84 Questions
Exam 17: Quality Management103 Questions
Select questions type
Briefly list strengths and weaknesses of this display.Cite specific principles of good graphs,as well as offering your own general interpretation. 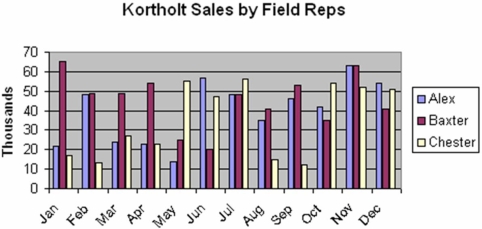
(Essay)
4.9/5  (35)
(35)
In a bimodal histogram,the two highest bars will have the same height.
(True/False)
4.8/5 (34)
A study found the following parts per billion of nitrosamines in a sample of domestic beers.(a)Construct a frequency distribution of four classes with equal class sizes.(b)Construct another frequency distribution of four classes using unequal class intervals or an open-ended interval for the highest class.(c)Which frequency distribution is preferable? Why? 
(Essay)
4.9/5 (39)
Pie charts are useful in displaying frequencies that sum to a total.
(True/False)
4.9/5 (36)
Briefly list strengths and weaknesses of this display.Cite specific principles of good graphs,as well as offering your own general interpretation. 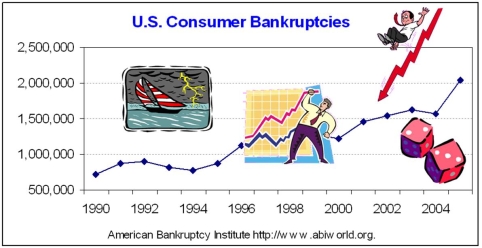
(Essay)
4.9/5 (45)
Briefly list strengths and weaknesses of this display.Cite specific principles of good graphs,as well as offering your own general interpretation. 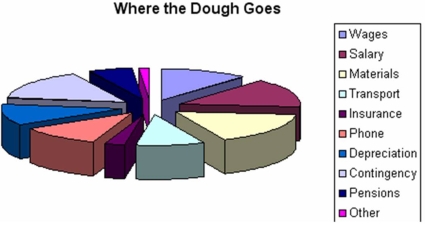
(Essay)
4.9/5 (34)
Which is not a characteristic of a log scale for time series data?
(Multiple Choice)
4.9/5 (39)
The number of bins in this histogram (caffeine content in mg/oz for 65 soft drinks)is consistent with Sturges' Rule. 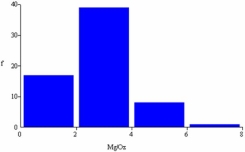
(True/False)
4.9/5 (33)
The point halfway between the bin limits in a frequency distribution is known as the:
(Multiple Choice)
4.8/5 (45)
A dot plot would be useful in visualizing scores on an exam in a class of 30 students.
(True/False)
4.9/5 (41)
If you have 256 data points,how many classes (bins)would Sturges' Rule suggest?
(Multiple Choice)
4.9/5 (43)
Briefly list strengths and weaknesses of this display.Cite specific principles of good graphs,as well as offering your own general interpretation. 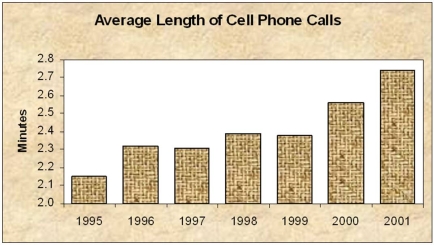
(Essay)
4.7/5 (30)
Filters
- Essay(0)
- Multiple Choice(0)
- Short Answer(0)
- True False(0)
- Matching(0)