Exam 3: Describing Data Visually
Exam 1: Overview of Statistics50 Questions
Exam 2: Data Collection95 Questions
Exam 3: Describing Data Visually108 Questions
Exam 4: Descriptive Statistics134 Questions
Exam 5: Probability121 Questions
Exam 6: Discrete Probability Distributions127 Questions
Exam 7: Continuous Probability Distributions112 Questions
Exam 8: Sampling Distributions and Estimation99 Questions
Exam 9: One-Sample Hypothesis Tests136 Questions
Exam 10: Two-Sample Hypothesis Tests115 Questions
Exam 11: Analysis of Variance141 Questions
Exam 12: Simple Regression120 Questions
Exam 13: Multiple Regression111 Questions
Exam 14: Time-Series Analysis111 Questions
Exam 15: Chi-Square Tests94 Questions
Exam 16: Nonparametric Tests84 Questions
Exam 17: Quality Management103 Questions
Select questions type
Which is not a characteristic of an effective summary table?
(Multiple Choice)
4.8/5  (27)
(27)
A bar chart can sometimes be used instead of a line chart for time series data.
(True/False)
4.9/5 (31)
Ten part-time servers at a high-end restaurant were asked how many hours they worked last week,and how much they earned.The results are shown below.(a)Make a scatter plot.(b)Describe it.(c)What is your best guess of the average hourly pay? 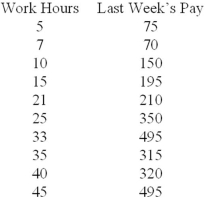
(Essay)
4.8/5 (33)
Scatter plots are used to visualize association in samples of paired data (X,Y).
(True/False)
5.0/5 (42)
To classify prices from 62 recent home sales,Sturges' Rule would recommend:
(Multiple Choice)
4.8/5 (42)
Below is a sorted stem-and-leaf diagram for the measured speeds (miles per hour)of 49 randomly chosen vehicles on highway I-80 in Nebraska.How many vehicles were traveling exactly the speed limit (70 mph)? 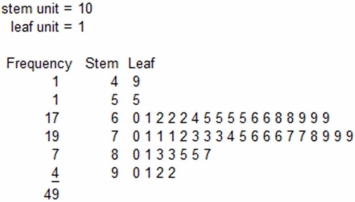
(Multiple Choice)
4.9/5 (35)
Briefly list strengths and weaknesses of this display.Cite specific principles of good graphs,as well as offering your own general interpretation. 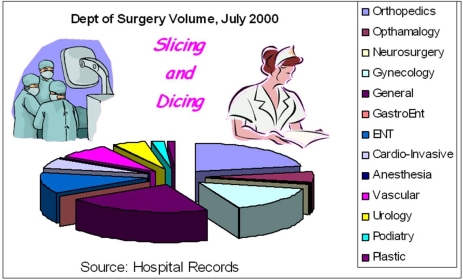
(Essay)
4.9/5 (38)
If you have 32 data points,how many classes (bins)would Sturges' Rule suggest?
(Multiple Choice)
4.8/5 (32)
Pie charts are attractive to statisticians,but are rarely used in business or general media.
(True/False)
4.8/5 (35)
Students were given a take-home statistics assignment and were asked to write down how long it took them (in minutes).Their answers are shown below.(a)Make a dot plot.(b)Use your judgment to construct a frequency distribution using whatever classes (bins)you wish.(c)Make a histogram.(d)Describe the distribution.(e)Did your bin choices agree with Sturges' Rule? If not,why not? 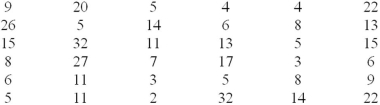
(Essay)
4.9/5 (38)
Below is a sorted stem-and-leaf diagram for the measured speeds (miles per hour)of 49 randomly chosen vehicles on highway I-80 in Nebraska.What is the fourth slowest speed in the sorted data array? 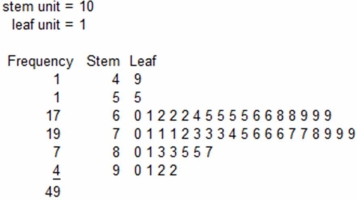
(Multiple Choice)
4.9/5 (39)
Briefly list strengths and weaknesses of this display.Cite specific principles of good graphs,as well as offering your own general interpretation. 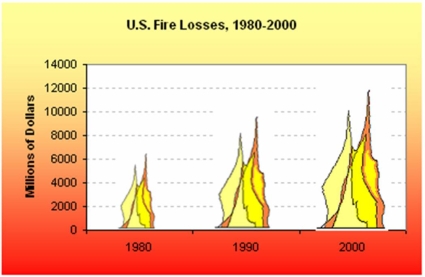
(Essay)
4.9/5 (32)
Students were asked to record how many hours they worked at an outside job last week.Their answers are shown below.(a)Make a dot plot.(b)Use your judgment to construct a frequency distribution using whatever classes (bins)you wish.(c)Make a histogram.(d)Describe the distribution.(e)Did your bin choices agree with Sturges' Rule? If not,why not? 
(Essay)
4.9/5 (37)
Filters
- Essay(0)
- Multiple Choice(0)
- Short Answer(0)
- True False(0)
- Matching(0)