Exam 12: A: linear Regression and Correlation
Exam 1: Describing Data With Graphs134 Questions
Exam 2: Describing Data With Numerical Measures235 Questions
Exam 3: Describing Bivariate Data57 Questions
Exam 4: A: probability and Probability Distributions107 Questions
Exam 4: B: probability and Probability Distributions157 Questions
Exam 5: Several Useful Discrete Distributions166 Questions
Exam 6: The Normal Probability Distribution235 Questions
Exam 7: Sampling Distributions231 Questions
Exam 8: Large-Sample Estimation187 Questions
Exam 9: A: large-Sample Tests of Hypotheses154 Questions
Exam 9: B: large-Sample Tests of Hypotheses106 Questions
Exam 10: A: Inference From Small Samples192 Questions
Exam 10: B: Inference From Small Samples124 Questions
Exam 11: A: The Analysis of Variance136 Questions
Exam 11: B: The Analysis of Variance137 Questions
Exam 12: A: linear Regression and Correlation131 Questions
Exam 12: B: linear Regression and Correlation171 Questions
Exam 13: Multiple Regression Analysis232 Questions
Exam 14: Analysis of Categorical Data158 Questions
Exam 15: A:nonparametric Statistics139 Questions
Exam 15: B:nonparametric Statistics95 Questions
Select questions type
In a simple linear regression , the following statistics are calculated from a sample of ten observations: 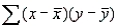 = 2250,
  = 10,
= 10,  = 50,
= 50,  = 75. Which of the following values equals the least-squares estimates of the slope and y-intercept, respectively?
(Multiple Choice)
4.7/5  (38)
(38)
An automobile company in Ontario is interested in the relationship between the gender of its employees and employee productivity. A good starting point in this analysis would be to compute the coefficient of determination and the correlation coefficient.
(True/False)
4.9/5 (40)
In simple linear regression, if the estimated values  and the corresponding actual values
  are equal, then the standard error of estimate, SE(
  ), must equal -1.0.
(True/False)
4.8/5 (33)
In a simple linear regression setting, the deterministic model equation determines an exact value of the dependent variable y when the value of the independent variable x is given, since all points must lie exactly on the line.
(True/False)
4.9/5 (33)
If there is a negative correlation between the independent variable x and the dependent variable y, then to test this, the appropriate null and alternative hypotheses would be  vs.
vs. 
(True/False)
4.9/5 (43)
In developing an 80% prediction interval for the particular value of y from a simple linear regression involving a sample of size 12, the appropriate t-table value would be 1.372.
(True/False)
4.8/5 (34)
In order to predict with 95% confidence a particular value of  for a given value of
  in a simple linear regression , a random sample of 20 observations is taken. The appropriate t-table value that would be used is 2.101.
(True/False)
4.7/5 (31)
Which of the following is the appropriate null hypothesis to test whether a population correlation is 0?
(Multiple Choice)
4.8/5 (24)
If the coefficient of determination value for a simple linear regression model is 0.90, then the correlation coefficient between the two variables will be 0.81.
(True/False)
4.9/5 (43)
Simple regression analysis is a statistical technique that establishes an index which provides, in a single number, a measure of the strength of association between two variables.
(True/False)
4.8/5 (28)
In a simple linear regression analysis, if the t test statistic for testing the significance of the regression model is 3.4, then the F test statistic from the ANOVA table for regression will be 11.56.
(True/False)
4.9/5 (33)
In regression analysis, a graph of each residual against the corresponding fitted value is called a scatter diagram.
(True/False)
4.8/5 (39)
In simple linear regression, most often we perform a two-tailed test of the population slope  to determine whether there is sufficient evidence to infer that a linear relationship exists. How should we state the null hypothesis?
A)
B)
C)
D)
to determine whether there is sufficient evidence to infer that a linear relationship exists. How should we state the null hypothesis?
A)
B)
C)
D)
(Not Answered)
This question doesn't have any answer yet
If a simple linear regression model has no y-intercept, then which of the following may be deduced about the values of the variables?
(Multiple Choice)
4.8/5 (37)
In a simple linear regression , the following sums of squares are produced: 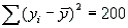 ,
, 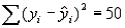 , and
, and 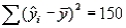 . What percentage of the variation in y may be explained by the variation in x?
(Multiple Choice)
4.9/5 (34)
A regression analysis between sales (in $1000) and advertising (in $) resulted in the following least-squares line:  = 80,000 + 5x. What does this imply?
(Multiple Choice)
4.9/5 (32)
If the sum of squares for error is equal to 0, then what must the coefficient of determination (  ) equal?
(Multiple Choice)
4.8/5 (31)
If a set of data contains no values of the independent variable x that are equal to 0, then the y-intercept regression coefficient  has no particular meaning.
(True/False)
4.7/5 (29)
Given the least-squares regression line  = -4.63 + 1.38x, and a coefficient of determination of 0.9025, what is the correlation coefficient?
(Multiple Choice)
4.8/5 (38)
Given the least-squares regression line  = 5 -2x, what may be said about the relationship between the two variables?
(Multiple Choice)
4.8/5 (33)
Filters
- Essay(0)
- Multiple Choice(0)
- Short Answer(0)
- True False(0)
- Matching(0)