Exam 9: B: large-Sample Tests of Hypotheses
Exam 1: Describing Data With Graphs134 Questions
Exam 2: Describing Data With Numerical Measures235 Questions
Exam 3: Describing Bivariate Data57 Questions
Exam 4: A: probability and Probability Distributions107 Questions
Exam 4: B: probability and Probability Distributions157 Questions
Exam 5: Several Useful Discrete Distributions166 Questions
Exam 6: The Normal Probability Distribution235 Questions
Exam 7: Sampling Distributions231 Questions
Exam 8: Large-Sample Estimation187 Questions
Exam 9: A: large-Sample Tests of Hypotheses154 Questions
Exam 9: B: large-Sample Tests of Hypotheses106 Questions
Exam 10: A: Inference From Small Samples192 Questions
Exam 10: B: Inference From Small Samples124 Questions
Exam 11: A: The Analysis of Variance136 Questions
Exam 11: B: The Analysis of Variance137 Questions
Exam 12: A: linear Regression and Correlation131 Questions
Exam 12: B: linear Regression and Correlation171 Questions
Exam 13: Multiple Regression Analysis232 Questions
Exam 14: Analysis of Categorical Data158 Questions
Exam 15: A:nonparametric Statistics139 Questions
Exam 15: B:nonparametric Statistics95 Questions
Select questions type
Medical Instruments Narrative
In testing the hypotheses 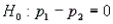 vs.
vs. 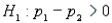 , the following statistics were obtained:
  ,
,  ,
,  , and
, and  , where
  and
and  represent the number of defective components found in medical instruments in the two samples.
-Refer to Medical Instruments Narrative. What conclusion can we draw at the 5% significance level?
represent the number of defective components found in medical instruments in the two samples.
-Refer to Medical Instruments Narrative. What conclusion can we draw at the 5% significance level?
(Essay)
4.8/5  (41)
(41)
Copper Pipes Narrative
A manufacturer of copper pipes must produce pipes with a diameter of precisely 5 cm. The firm's quality inspector wants to test the hypothesis that pipes of the proper size are being produced. Accordingly, a simple random sample of 100 pipes is taken from the production process. The sample mean diameter turns out to be 4.98 cm and the sample standard deviation 0.2 cm. Using a significance level of  = 0.05, test the appropriate hypotheses.
-An airline company would like to know if the average number of passengers on a flight in November is less than the average number of passengers on a flight in December. The results of random sampling are printed below. Test the appropriate hypotheses using = 0.01.
November
= 0.05, test the appropriate hypotheses.
-An airline company would like to know if the average number of passengers on a flight in November is less than the average number of passengers on a flight in December. The results of random sampling are printed below. Test the appropriate hypotheses using = 0.01.
November  December
(Essay)
4.8/5 (35)
Tennis Magazine Narrative
A marketing manager wants to test the hypothesis that 90% of Tennis magazine's subscribers are homeowners. Accordingly, a simple random sample of 80 is taken from the magazine's list of subscribers. The sample turns out to contain 64 homeowners. Use a significance level of  = 0.05.
-Refer to Tennis Magazine Narrative. Calculate the p-value and write your conclusion.
= 0.05.
-Refer to Tennis Magazine Narrative. Calculate the p-value and write your conclusion.
(Essay)
4.7/5 (26)
Average Childcare Costs Narrative
The public relations officer for a particular city claims the average monthly cost for childcare outside the home for a single child is $700. A potential resident is interested in whether the claim is correct. She obtains a random sample of 64 records and computes the average monthly cost of this type of childcare to be $689 with a standard deviation of $40.
-Refer to Average Childcare Costs Narrative. What effect, if any, would there be on the conclusion of the test of hypothesis in the first question if you changed  to 0.05?
(Essay)
4.8/5 (37)
University Housing Costs Narrative Describe the Type II error for this .
(Essay)
4.9/5 (33)
Nuclear Weapons Freeze Narrative
A group in favour of freezing production of nuclear weapons believes that the proportion of individuals in favour of a nuclear freeze is greater for those who have seen the movie "The Day After" (population 1) than those who have not (population 2). In an attempt to verify this belief, random samples of size 500 are obtained from the populations of interest. Among those who had seen "The Day After," 228 were in favour of a freeze. For those who had not seen the movie, 196 favoured a freeze.
-Refer to Environment Canada Project Narrative. What is the appropriate conclusion?
(Essay)
4.9/5 (36)
Medical School Completion Narrative
A university investigation was conducted to determine whether women and men complete medical school in significantly different amounts of time, on the average. Two independent random samples were selected and the following summary information concerning times to completion of medical school computed:  -Refer to Medical School Completion Narrative. Perform the appropriate test of hypothesis to determine whether there is a significant difference in time to completion of medical school between women and men. Test using = 0.05.
(Essay)
4.9/5 (34)
Life Insurance Narrative
An insurance company wants to test the hypothesis that the mean amount of life insurance held by professional men equals that held by professional women. Accordingly, two independent simple random samples are taken from appropriate professional listings of men and women. The sample of 200 men reveals a mean amount of $140,000 with a standard deviation of $26,000. The sample of 400 women shows a mean amount of $128,000 with a standard deviation of $3,000.
-Refer to Life Insurance Narrative. Calculate the value of the test statistic.
(Essay)
4.8/5 (33)
Allergy Drug Narrative
In clinical studies of an allergy drug, 81 of the 900 subjects experienced drowsiness. A competitor claims that 10% of the users of this drug experience drowsiness.
-Refer to Allergy Drug Narrative. Construct a 95% confidence interval estimate of the population proportion of the users of this allergy drug who experience drowsiness.
(Essay)
4.8/5 (37)
Gas Heat Narrative
A gas company president for a particular city is interested in the proportion of homes heated by gas. Historically, the proportion of homes heated by gas has been 0.65. A sample of 75 homes was selected and it was found that 44 of them heat with gas.
-The owner of a marina would like to believe that more than 40% of the sailboat owners use their boats more than 6 times each summer. A random sample of 70 sailboat owners showed 42 used their boats more than 6 times each summer. State and test the appropriate hypotheses using a significance level of 0.005. Is there a reason for the marina owner to believe more than 40% of the sailboat owners use their boats more than 6 times each summer?
(Essay)
4.9/5 (33)
Soap Sales Narrative
In testing the hypotheses  vs.
vs.  , use the following statistics:
  ,
,  ,
,  , and
, and  , where
  and
and  represent the number of Dial Soap sales in the two samples, respectively.
-Refer to Soap Sales Narrative. What conclusion can we draw at the 5% significance level? Justify your answer.
represent the number of Dial Soap sales in the two samples, respectively.
-Refer to Soap Sales Narrative. What conclusion can we draw at the 5% significance level? Justify your answer.
(Essay)
4.7/5 (24)
A random sample of 150 observations was selected from a binomial population, and 87 successes were observed. Do the data provide sufficient evidence to indicate that the population proportion p is greater than 0.5? Use the critical value approach and the p-value approach.
(Essay)
4.9/5 (43)
Nuclear Weapons Freeze Narrative
A group in favour of freezing production of nuclear weapons believes that the proportion of individuals in favour of a nuclear freeze is greater for those who have seen the movie "The Day After" (population 1) than those who have not (population 2). In an attempt to verify this belief, random samples of size 500 are obtained from the populations of interest. Among those who had seen "The Day After," 228 were in favour of a freeze. For those who had not seen the movie, 196 favoured a freeze.
-Refer to Nuclear Weapons Freeze Narrative. Find the appropriate test statistic.
(Essay)
4.9/5 (24)
A sample of size 80 is to be used to test the hypotheses H0: = 29 vs. Ha: > 29, where is the average age of a man when he gets married. What is the appropriate rejection region associated with each of the following significance levels?
a.  = 0.01
b.
= 0.01
b.  = 0.005
c.
= 0.005
c.  = 0.05
d.
= 0.05
d.  = 0.1
= 0.1
(Essay)
4.8/5 (38)
Drug Testing Narrative
An experiment was conducted to test the effect of a new drug on a viral infection. The infection was induced in 100 mice, and the mice were randomly split into 2 groups of 50. The first group, the control group, received no treatment for the infection. The second group received the drug. The proportions of survivors,  and
and  in the 2 groups after a 30-day period, were found to be 0.40 and 0.64, respectively.
-Refer to Drug Testing Narrative. Is there sufficient evidence to indicate that the drug is effective in treating the viral infection? Use
in the 2 groups after a 30-day period, were found to be 0.40 and 0.64, respectively.
-Refer to Drug Testing Narrative. Is there sufficient evidence to indicate that the drug is effective in treating the viral infection? Use 
(Essay)
4.8/5 (44)
Cable Narrative
A cable company in Ontario is thinking of offering its service in one of two cities: Guelph and Kitchener. Allegedly, there is a proportion of households in either city ready to be hooked up to the cable, but the company wants to test the claim. Accordingly, it takes a simple random sample in each city. In Guelph, 175 of 200 households say they will join. In Kitchener, 665 of 800 households say the same.
-Refer to Cable Narrative. State the appropriate hypotheses.
(Essay)
4.8/5 (29)
Allergy Drug Narrative
In clinical studies of an allergy drug, 81 of the 900 subjects experienced drowsiness. A competitor claims that 10% of the users of this drug experience drowsiness.
-Refer to Allergy Drug Narrative. State the appropriate null and hypotheses.
(Essay)
4.9/5 (35)
Nuclear Weapons Freeze Narrative
A group in favour of freezing production of nuclear weapons believes that the proportion of individuals in favour of a nuclear freeze is greater for those who have seen the movie "The Day After" (population 1) than those who have not (population 2). In an attempt to verify this belief, random samples of size 500 are obtained from the populations of interest. Among those who had seen "The Day After," 228 were in favour of a freeze. For those who had not seen the movie, 196 favoured a freeze.
-A manufacturing plant has two assembly lines for producing plastic bottles. The plant manager was concerned about whether the proportion of defective bottles differed between the two lines. Two independent random samples were selected and the following summary data computed:  Perform the appropriate test of hypothesis using = 0.05.
(Essay)
4.9/5 (36)
Laptop Battery Charge Time Narrative
A computer laboratory manager was in charge of purchasing new battery packs for her lab of laptop computers. She narrowed her choices to two models that were available for her machines. Since the models cost about the same, she was interested in determining whether there was a difference in the average time the battery packs would function before needing to be recharged. She took two independent samples and computed the following summary information:  -Refer to Laptop Battery Charge Time Narrative. Perform the appropriate test of hypothesis to determine whether there is a significant difference in average functioning time before recharging between the two models of battery packs. Test using
  = 0.10.
(Essay)
4.8/5 (33)
Medical Instruments Narrative
In testing the hypotheses vs. , the following statistics were obtained: , , , and , where and represent the number of defective components found in medical instruments in the two samples.
-Refer to Medical Instruments Narrative. Estimate with 95% confidence the difference between the two population proportions.
(Essay)
4.8/5 (34)
Filters
- Essay(0)
- Multiple Choice(0)
- Short Answer(0)
- True False(0)
- Matching(0)