Exam 15: Dsge Models: the Frontier of Business Cycle Research
Exam 1: Introduction to Macroeconomics35 Questions
Exam 2: Measuring the Macroeconomy114 Questions
Exam 3: An Overview of Long-Run Economic Growth110 Questions
Exam 4: A Model of Production129 Questions
Exam 5: The Solow Growth Model126 Questions
Exam 6: Growth and Ideas120 Questions
Exam 7: The Labor Market, Wages, and Unemployment119 Questions
Exam 8: Inflation117 Questions
Exam 9: An Introduction to the Short Run113 Questions
Exam 10: The Great Recession: a First Look108 Questions
Exam 11: The Is Curve128 Questions
Exam 12: Monetary Policy and the Phillips Curve135 Questions
Exam 13: Stabilization Policy and the Asad Framework113 Questions
Exam 14: The Great Recession and the Short-Run Model112 Questions
Exam 15: Dsge Models: the Frontier of Business Cycle Research119 Questions
Exam 16: Consumption109 Questions
Exam 17: Investment116 Questions
Exam 18: The Government and the Macroeconomy122 Questions
Exam 19: International Trade107 Questions
Exam 20: Exchange Rates and International Finance142 Questions
Exam 21: Parting Thoughts35 Questions
Select questions type
Refer to the following figure when answering the following questions.
Figure 15.1: The Labor Market 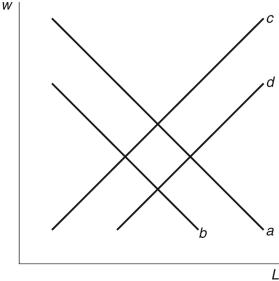 -Consider Figure 15.1, which is a representation of the labor market. In 2005, Hurricane Katrina hit the Gulf Coast of the United States; this would cause a shift from curve ________ because this is an example of a(n) ________.
(Multiple Choice)
4.9/5  (34)
(34)
A change in total factor productivity will increase the demand for labor, which shifts the labor demand curve to the right.
(True/False)
4.9/5 (44)
The labor supply curve is increasing in ________ and decreasing in ________.
(Multiple Choice)
4.9/5 (36)
The 1990s U.S. economy enjoyed a technology jump in the form of the Internet. Which of the following is likely to be predicted by a DSGE model?
i. A decline in the marginal product of labor
ii. A decrease in output
iii. An increase in the real wage
(Multiple Choice)
5.0/5 (36)
When taxes are included in the labor market in the stylized DSGE model, real wages increase.
(True/False)
4.9/5 (32)
Refer to the following figure when answering the following questions.
Figure 15.1: The Labor Market  -Consider Figure 15.1, which is a representation of the labor market. If the state of Colorado decided to raise its sales tax rate, this would cause a shift from curve ________, because changes in taxes are ________ in the stylized DSGE model.
(Multiple Choice)
4.9/5 (41)
In 2013, there were numerous global conflicts: civil war in Syria, unrest in Brazil, and continued turmoil in Iraq and Afghanistan. Though many of these conflicts are far from U.S. borders, how might they play out in the American economy (i.e., in labor markets), using the standard stylized version of the DSGE model? What if wages were sticky?
(Essay)
4.9/5 (43)
In the Smets-Wouters DSGE model, ________ when there is an increase in government spending because ________.
(Multiple Choice)
4.8/5 (41)
In the Smets-Wouters DSGE model, an increase in government spending will cause:
i. Real GDP to rise
ii. Consumption to fall
iii. Inflation to rise
(Multiple Choice)
4.7/5 (29)
Consider the impulse response functions generated using the Altiga, Christiano, Eichenbaum, and Lindé (2011) DSGE model in response to a monetary shock. The endogenous variables are the output gap (ytilde_t), consumption (c_tpred), inflation (inflationq), and the interest rate (interest). Briefly discuss the results of the simulations, using macroeconomic theory.
Figure 15.10: Impulse Response Function to a Change in Money Supply 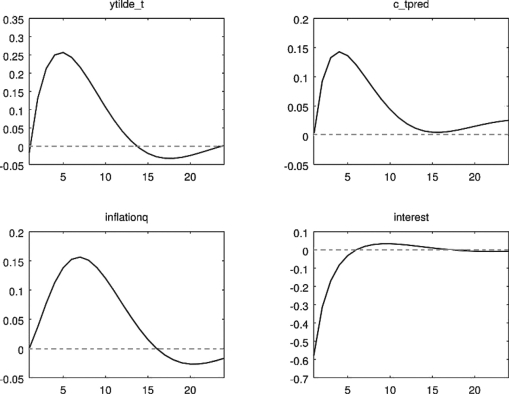
(Essay)
4.7/5 (26)
Refer to the following figure when answering the following questions.
Figure 15.2: The Labor Market 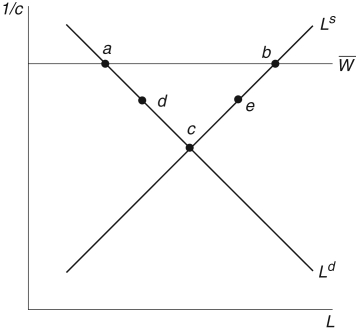 -In the stylized DSGE model for the labor market displayed in Figure 15.2, the line marked
  is due to which of the following?
i. Cyclical unemployment
ii. Sticky prices
iii. The natural rate of unemployment
is due to which of the following?
i. Cyclical unemployment
ii. Sticky prices
iii. The natural rate of unemployment
(Multiple Choice)
4.7/5 (34)
With sticky prices in the stylized DSGE model, a monetary expansion:
i. Increases real wages
ii. Increases nominal wages
iii. Reduces output
(Multiple Choice)
4.9/5 (40)
In the stylized DSGE model with sticky prices, how does contractionary monetary policy shock affect the labor market?
(Multiple Choice)
4.9/5 (22)
Consider the impulse response functions generated using the Smets and Wouters (2007) DSGE model, in response to a shock to productivity (TFP) and government expenditures as shown in Figures 15.8 and 15.9. The endogenous variables are consumption (c), inflation (pinf), labor supply (lab), and GDP (y). Briefly discuss the results of the simulations using macroeconomic theory.
Figure 15.8: Impulse Response Function to a Change in Productivity 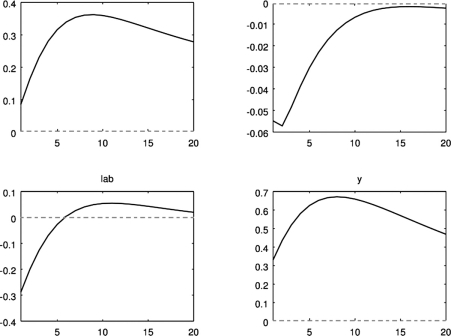 Figure 15.9: Impulse Response Function to a Change in Government Spending
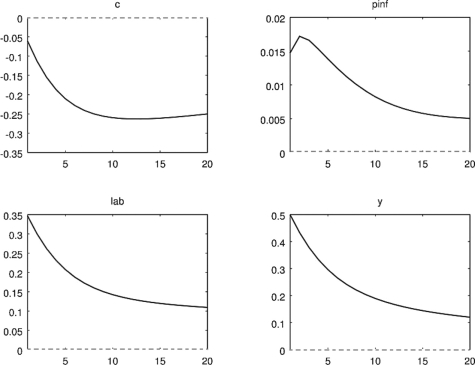
(Essay)
4.9/5 (37)
Refer to the following figure when answering the following questions.
Figure 15.1: The Labor Market
-Consider Figure 15.1, which is a representation of the labor market. If an economy improves its legal system, you would see a shift from curve ________ because this is an example of a(n) ________.
(Multiple Choice)
4.9/5 (42)
In the stylized DSGE model, the variable that allows future events to affect the economy today is inflation expectation.
(True/False)
4.7/5 (34)
Filters
- Essay(0)
- Multiple Choice(0)
- Short Answer(0)
- True False(0)
- Matching(0)