Exam 13: Simulation Modeling
Exam 1: Introduction to Quantitative Analysis96 Questions
Exam 2: Probability Concepts and Applications155 Questions
Exam 3: Decision Analysis128 Questions
Exam 4: Regression Models129 Questions
Exam 5: Forecasting138 Questions
Exam 6: Inventory Control Models147 Questions
Exam 7: Linear Programming Models: Graphical and Computer Methods141 Questions
Exam 8: Linear Programming Applications89 Questions
Exam 9: Transportation, Assignment, and Network Models112 Questions
Exam 10: Integer Programming, Goal Programming, and Nonlinear Programming86 Questions
Exam 11: Project Management142 Questions
Exam 12: Waiting Lines and Queuing Theory Models127 Questions
Exam 13: Simulation Modeling94 Questions
Exam 14: Markov Analysis103 Questions
Exam 15: Statistical Quality Control96 Questions
Exam 16: Analytic Hierarchy Process66 Questions
Exam 17: Dynamic Programming86 Questions
Exam 18: Decision Theory and the Normal Distribution62 Questions
Exam 19: Game Theory59 Questions
Exam 20: Mathematical Tools: Determinants and Matrices104 Questions
Exam 21: Calculus-Based Optimization39 Questions
Exam 22: Linear Programming: The Simplex Method98 Questions
Exam 23: Transportation, Assignment, and Network Algorithms120 Questions
Select questions type
The four disadvantages of simulation are cost, its trial-and-error nature, time compression, and uniqueness.
(True/False)
4.9/5  (40)
(40)
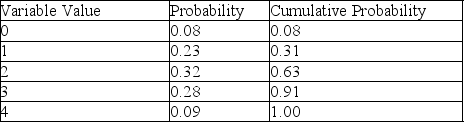
Table 13-6
Paul prepares a variety of Creole and Cajun dishes to the delight of his diners at his restaurant in the French Quarter.Demand for crawfish etouffee follows this historical distribution:
 Each recipe of crawfish etouffee calls for two sticks of butter which the prep chef must buy down the block at a local grocery store.Paul would like to put in a special butter refrigerator and needs to estimate the capacity he would need if he orders twice a week from his butter supplier.He decides to simulate two weeks of this process using the historical distribution mapped to random numbers ranging from 01-00 and the random number table below.
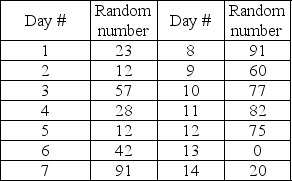 -What is the demand for etouffee on day 13 dictated by the random number shown in Table 13-6?
(Multiple Choice)
4.8/5 (36)
Describe the conditions when simulation is useful for inventory analysis.
(Essay)
4.9/5 (42)
The process of comparing a model to the real system that it represents to make sure it is accurate is called
(Multiple Choice)
4.9/5 (31)
The number of cars arriving at a self-service gasoline station during the last 50 hours of operation are as follows:
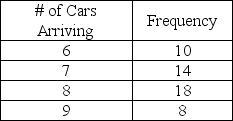 Create an appropriate table of intervals of random numbers.
(Essay)
4.9/5 (33)
Describe the conditions when simulation is useful for queuing analysis.
(Essay)
4.7/5 (32)
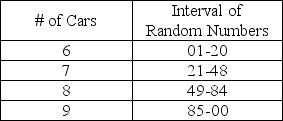
Consider the interval of random numbers presented below.The following random numbers have been generated: 99, 98, 26, 09, 49, 52, 33, 89, 21, 37.Simulate 10 hours of arrivals at this gas station.What is the average number of arrivals during this period?
(Essay)
4.7/5 (37)
Table 13-6
Paul prepares a variety of Creole and Cajun dishes to the delight of his diners at his restaurant in the French Quarter.Demand for crawfish etouffee follows this historical distribution:
Each recipe of crawfish etouffee calls for two sticks of butter which the prep chef must buy down the block at a local grocery store.Paul would like to put in a special butter refrigerator and needs to estimate the capacity he would need if he orders twice a week from his butter supplier.He decides to simulate two weeks of this process using the historical distribution mapped to random numbers ranging from 01-00 and the random number table below.
-What is the demand for etouffee on day 6 dictated by the random number shown in Table 13-6?
(Multiple Choice)
4.8/5 (32)
Table 13-2
A new young mother has opened a cloth diaper service.She is interested in simulating the number of diapers required for a one-year-old.She hopes to use this data to show the cost effectiveness of cloth diapers.The table below shows the number of diapers demanded daily and the probabilities associated with each level of demand.
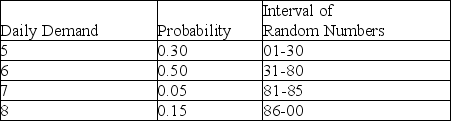 -According to Table 13-2, if the random number 96 were generated for a particular day, what would the simulated demand be for that day?
(Multiple Choice)
4.8/5 (39)
Table 13-2
A new young mother has opened a cloth diaper service.She is interested in simulating the number of diapers required for a one-year-old.She hopes to use this data to show the cost effectiveness of cloth diapers.The table below shows the number of diapers demanded daily and the probabilities associated with each level of demand.
-According to Table 13-2, if the random number 40 were generated for a particular day, what would the simulated demand be for that day?
(Multiple Choice)
4.9/5 (36)
Table 13-5
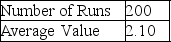 -According to Table 13-5, which presents a summary of the Monte Carlo output from a simulation of 200 runs, there are 5 possible values for the variable of concern.If this variable represents the number of machine breakdowns during a day, what is the probability that the number of breakdowns is 2 or fewer?
(Multiple Choice)
4.8/5 (42)
The wider the variation among results produced by using different sets of random numbers, the longer we need to run the simulation to obtain reliable results.
(True/False)
4.8/5 (35)
Simulation can use any probability distribution that the user defines; it does not require standard distributions.
(True/False)
4.8/5 (31)
Table 13-4
A pawn shop in Arlington, Texas, has a drive-through window to better serve customers.The following tables provide information about the time between arrivals and the service times required at the window on a particularly busy day of the week.All times are in minutes.
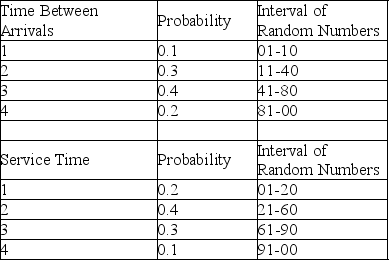 The first random number generated for arrivals is used to tell when the first customer arrives after opening.
-According to Table 13-4, the time between successive arrivals is 1, 2, 3, or 4 minutes.The store opens at 8:00 a.m., and random numbers are used to generate arrivals and service times.The first 3 random numbers to generate arrivals are 09, 89, and 26.What time does the third customer arrive?
The first random number generated for arrivals is used to tell when the first customer arrives after opening.
-According to Table 13-4, the time between successive arrivals is 1, 2, 3, or 4 minutes.The store opens at 8:00 a.m., and random numbers are used to generate arrivals and service times.The first 3 random numbers to generate arrivals are 09, 89, and 26.What time does the third customer arrive?
(Multiple Choice)
4.9/5 (37)
Average daily sales of a product are 8 units.The actual number of sales each day is either 7, 8, or 9, with probabilities 0.3, 0.4, and 0.3, respectively.The lead time for delivery of this averages 4 days, although the time may be 3, 4, or 5 days, with probabilities 0.2, 0.6, and 0.2.The company plans to place an order when the inventory level drops to 32 units (based on the average demand and average lead time).The following random numbers have been generated: 60, 87, 46, 63 (set 1)and 52, 78, 13, 06, 99, 98, 80, 09, 67, 89, 45 (set 2).Use set 1 of these to generate lead times and use set 2 to simulate daily demand.Simulate 2 ordering periods with this and determine how often the company runs out of stock before the shipment arrives.Assume 32 units on-hand and an order was just placed.
(Essay)
4.8/5 (39)
Operational gaming refers to simulation involving two or more competing agents.
(True/False)
4.8/5 (28)
Table 13-6
Paul prepares a variety of Creole and Cajun dishes to the delight of his diners at his restaurant in the French Quarter.Demand for crawfish etouffee follows this historical distribution:
Each recipe of crawfish etouffee calls for two sticks of butter which the prep chef must buy down the block at a local grocery store.Paul would like to put in a special butter refrigerator and needs to estimate the capacity he would need if he orders twice a week from his butter supplier.He decides to simulate two weeks of this process using the historical distribution mapped to random numbers ranging from 01-00 and the random number table below.
-Paul decides to order butter every four days and decides to maintain a level of inventory that is the sum of the four highest consecutive days' demand plus 10%.Based on this two-week simulation, what should his stocking level be for the scenario shown in Table 13-6?
(Multiple Choice)
4.9/5 (38)
Table 13-6
Paul prepares a variety of Creole and Cajun dishes to the delight of his diners at his restaurant in the French Quarter.Demand for crawfish etouffee follows this historical distribution:
Each recipe of crawfish etouffee calls for two sticks of butter which the prep chef must buy down the block at a local grocery store.Paul would like to put in a special butter refrigerator and needs to estimate the capacity he would need if he orders twice a week from his butter supplier.He decides to simulate two weeks of this process using the historical distribution mapped to random numbers ranging from 01-00 and the random number table below.
-Use the information in Table 13-6 to determine the range of random numbers corresponding to demand for 22 orders per day.
(Multiple Choice)
4.9/5 (40)
Simulation models are useful for economic order quantity problems with probabilistic demand and lead time.
(True/False)
4.8/5 (43)
Filters
- Essay(0)
- Multiple Choice(0)
- Short Answer(0)
- True False(0)
- Matching(0)