Exam 13: Simulation Modeling
Exam 1: Introduction to Quantitative Analysis96 Questions
Exam 2: Probability Concepts and Applications155 Questions
Exam 3: Decision Analysis128 Questions
Exam 4: Regression Models129 Questions
Exam 5: Forecasting138 Questions
Exam 6: Inventory Control Models147 Questions
Exam 7: Linear Programming Models: Graphical and Computer Methods141 Questions
Exam 8: Linear Programming Applications89 Questions
Exam 9: Transportation, Assignment, and Network Models112 Questions
Exam 10: Integer Programming, Goal Programming, and Nonlinear Programming86 Questions
Exam 11: Project Management142 Questions
Exam 12: Waiting Lines and Queuing Theory Models127 Questions
Exam 13: Simulation Modeling94 Questions
Exam 14: Markov Analysis103 Questions
Exam 15: Statistical Quality Control96 Questions
Exam 16: Analytic Hierarchy Process66 Questions
Exam 17: Dynamic Programming86 Questions
Exam 18: Decision Theory and the Normal Distribution62 Questions
Exam 19: Game Theory59 Questions
Exam 20: Mathematical Tools: Determinants and Matrices104 Questions
Exam 21: Calculus-Based Optimization39 Questions
Exam 22: Linear Programming: The Simplex Method98 Questions
Exam 23: Transportation, Assignment, and Network Algorithms120 Questions
Select questions type
Simulation of maintenance problems can help management analyze various staffing strategies based on machine downtime and labor cost.
(True/False)
4.8/5  (34)
(34)
Which of the following represents the primary reason simulation cannot be used for the classic EOQ model?
(Multiple Choice)
4.9/5 (27)
Econometric models are typically huge simulations involving thousands of queuing equations tied together by economics factors.
(True/False)
4.9/5 (31)
Table 13-6
Paul prepares a variety of Creole and Cajun dishes to the delight of his diners at his restaurant in the French Quarter.Demand for crawfish etouffee follows this historical distribution:
 Each recipe of crawfish etouffee calls for two sticks of butter which the prep chef must buy down the block at a local grocery store.Paul would like to put in a special butter refrigerator and needs to estimate the capacity he would need if he orders twice a week from his butter supplier.He decides to simulate two weeks of this process using the historical distribution mapped to random numbers ranging from 01-00 and the random number table below.
 -Use the information in Table 13-6 to determine the range of random numbers corresponding to demand for 30 orders per day.
(Multiple Choice)
4.8/5 (38)
Paul prepares a variety of Creole and Cajun dishes to the delight of his diners at his restaurant in the French Quarter.Demand for crawfish etouffee follows this historical distribution:
 Each recipe of crawfish etouffee calls for two sticks of butter which the prep chef must buy down the block at a local grocery store.Paul would like to put in a special butter refrigerator and needs to estimate the capacity he would need if he orders twice a week from his butter supplier.He decides to simulate two weeks of this process using the historical distribution mapped to random numbers ranging from 01-00 and the random number table below.
 Paul decides to run the simulation for two weeks and maintain a stock equivalent to the highest four consecutive days' demand plus two emergency sticks.How much butter should he stock?
(Essay)
4.8/5 (36)
Table 13-7
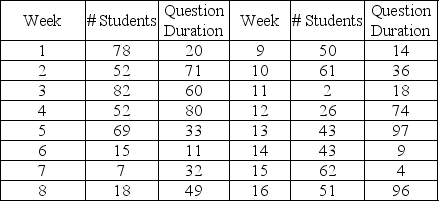
A professor dutifully holds six office hours per week as dictated by an archaic policy.Demand for office hours varies wildly as reflected in this historical data.
 The duration of time to answer questions varies independently from the actual demand.Question duration is reflected in this table.
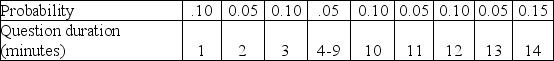 Entries in the student demand and question duration tables that reflect a range in demand, i.e., 3-9 students per six hours or 4-9 minutes should be treated as collapsed entries in the table.Thus, a question duration of 4 minutes has a 0.05 probability, a question duration of 5 minutes also has a 0.05 probability, and so on up through 9 minutes and a 0.05 probability.
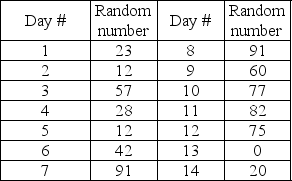
This table contains random numbers for the number of students and duration of question for a 16-week period.
Entries in the student demand and question duration tables that reflect a range in demand, i.e., 3-9 students per six hours or 4-9 minutes should be treated as collapsed entries in the table.Thus, a question duration of 4 minutes has a 0.05 probability, a question duration of 5 minutes also has a 0.05 probability, and so on up through 9 minutes and a 0.05 probability.
This table contains random numbers for the number of students and duration of question for a 16-week period.
 Use the question duration figure as the time required to answer questions for each student that week, so if three students arrive in week seven and the average duration is ten minutes, the total time spent answering questions that week is thirty minutes.
-What is the highest total time spent answering questions of all the weeks shown in Table 13-7?
Use the question duration figure as the time required to answer questions for each student that week, so if three students arrive in week seven and the average duration is ten minutes, the total time spent answering questions that week is thirty minutes.
-What is the highest total time spent answering questions of all the weeks shown in Table 13-7?
(Multiple Choice)
4.9/5 (36)
Table 13-1
The table below represents the probability distribution for machine breakdowns in a day of operation.
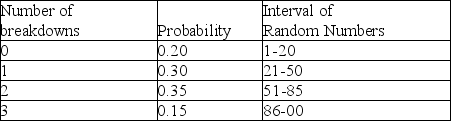 -According to Table 13-1, if a random number of 00 is drawn, what would the simulated number of breakdowns be?
(Multiple Choice)
4.8/5 (30)
Table 13-6
Paul prepares a variety of Creole and Cajun dishes to the delight of his diners at his restaurant in the French Quarter.Demand for crawfish etouffee follows this historical distribution:
Each recipe of crawfish etouffee calls for two sticks of butter which the prep chef must buy down the block at a local grocery store.Paul would like to put in a special butter refrigerator and needs to estimate the capacity he would need if he orders twice a week from his butter supplier.He decides to simulate two weeks of this process using the historical distribution mapped to random numbers ranging from 01-00 and the random number table below.
-At what level of nightly order for etouffee does the cumulative probability reach 50% for the scenario shown in Table 13-6?
(Multiple Choice)
4.7/5 (37)
Table 13-7
A professor dutifully holds six office hours per week as dictated by an archaic policy.Demand for office hours varies wildly as reflected in this historical data.
The duration of time to answer questions varies independently from the actual demand.Question duration is reflected in this table.
Entries in the student demand and question duration tables that reflect a range in demand, i.e., 3-9 students per six hours or 4-9 minutes should be treated as collapsed entries in the table.Thus, a question duration of 4 minutes has a 0.05 probability, a question duration of 5 minutes also has a 0.05 probability, and so on up through 9 minutes and a 0.05 probability.
This table contains random numbers for the number of students and duration of question for a 16-week period.
Use the question duration figure as the time required to answer questions for each student that week, so if three students arrive in week seven and the average duration is ten minutes, the total time spent answering questions that week is thirty minutes.
-What is the number of students that show up in a six-hour period during week 3 according to the information contained in Table 13-7?
(Multiple Choice)
4.9/5 (44)
Many companies use computerized simulation models to decide when to shut down an entire plant for maintenance activities.
(True/False)
4.8/5 (39)
Table 13-2
A new young mother has opened a cloth diaper service.She is interested in simulating the number of diapers required for a one-year-old.She hopes to use this data to show the cost effectiveness of cloth diapers.The table below shows the number of diapers demanded daily and the probabilities associated with each level of demand.
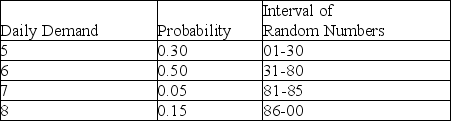 -According to Table 13-2, what is the cumulative probability that demand is less than or equal to 7?
(Multiple Choice)
4.9/5 (34)
Simulation models are designed to generate optimal solutions, which can then be applied to real-world situations.
(True/False)
5.0/5 (43)
What is the probability of selecting any random number from a two-digit table?
(Multiple Choice)
4.8/5 (42)
Filters
- Essay(0)
- Multiple Choice(0)
- Short Answer(0)
- True False(0)
- Matching(0)