Exam 10: Project Scheduling: Lagging, Crashing, and Activity Networks
Exam 1: Introduction: Why Project Management88 Questions
Exam 2: The Organizational Context: Strategy, Structure, and Culture90 Questions
Exam 3: Project Selection and Portfolio Management95 Questions
Exam 4: Leadership and the Project Manager108 Questions
Exam 5: Scope Management96 Questions
Exam 6: Project Team Building, Conflict, and Negotiation104 Questions
Exam 7: Risk Management95 Questions
Exam 8: Cost Estimation and Budgeting95 Questions
Exam 9: Project Scheduling: Networks, Duration Estimation, and Critical Path98 Questions
Exam 10: Project Scheduling: Lagging, Crashing, and Activity Networks90 Questions
Exam 11: Critical Chain Project Scheduling98 Questions
Exam 12: Resource Management79 Questions
Exam 13: Project Evaluation and Control98 Questions
Exam 14: Project Closeout and Termination100 Questions
Select questions type
Use the Gantt chart and activity list to determine which resource has the greatest continual use. 

(Multiple Choice)
4.9/5  (45)
(45)
The logical relationship between the start and finish of one activity and the start and finish of another activity is the __________.
(Short Answer)
4.8/5 (34)
Which of these approaches will NOT accelerate the completion of a project?
(Multiple Choice)
4.8/5 (38)
Use the information in the table (all times are in days) to determine the lowest cost minimum completion time? 
(Multiple Choice)
4.9/5 (35)
What is the early start time for activity C if it has the start to start relationship shown? 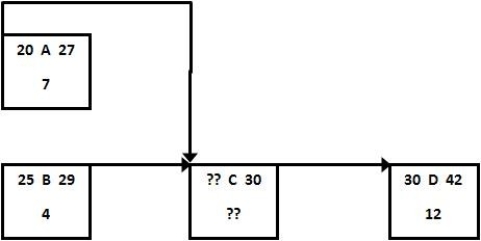
(Multiple Choice)
4.8/5 (38)
What is a Gantt chart, what information does one provide, and what are the benefits of using one?
(Essay)
4.9/5 (33)
A project has the activity duration and cost information indicated in the table where all times are in weeks. What is the lowest total cost for completing this project in 45 days? 
(Multiple Choice)
4.7/5 (31)
The least common type of lag relationship occurs when a successor's finish is dependent upon a predecessor's start.
(True/False)
4.8/5 (44)
A project manager ascertained that five different resources are needed to complete a project that has been estimated to last 37 days. Just to be on the safe side, the project manager told the client that the project would definitely be delivered in 40 days and 40 nights and arranged to rent the resources for that period of time. The project manager goes to the local rental center at the start of day 1 of the project, signs a 40-day lease agreement for all five resources, and brings them to the site to begin the project. Analyze the Gantt chart and resource list (activity durations are in parenthesis) and determine how much money is being wasted with this rental plan. If each resource could be rented for just the time it takes to complete each activity, what would the charge to the project be? 


(Essay)
4.9/5 (39)
Use the Gantt chart and the activity list to determine when resource 2 is free. 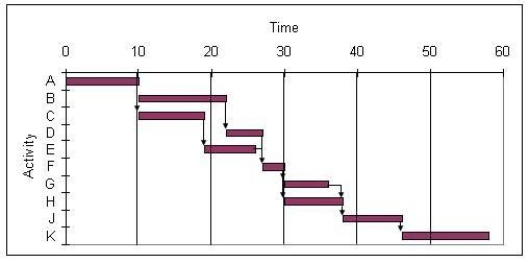

(Multiple Choice)
4.8/5 (36)
Most activity estimations using PERT methods lead to overly optimistic activity duration estimates.
(True/False)
4.9/5 (32)
Use the Gantt chart and activity list to determine which resource is used the least. 

(Multiple Choice)
4.7/5 (37)
Use the Gantt chart and activity list to determine which resource is used the most. 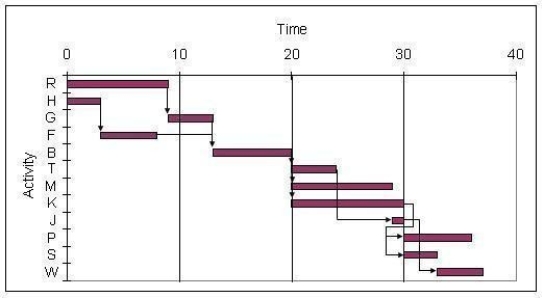

(Multiple Choice)
4.8/5 (44)
Filters
- Essay(0)
- Multiple Choice(0)
- Short Answer(0)
- True False(0)
- Matching(0)