Exam 4: Demand and Supply
Exam 1: Getting Started121 Questions
Exam 2: The Australian and Global Economies84 Questions
Exam 3: The Economic Problem70 Questions
Exam 4: Demand and Supply139 Questions
Exam 5: Elasticities of Demand and Supply125 Questions
Exam 6: Efficiency and Fairness of Markets130 Questions
Exam 7: Government Actions in Markets96 Questions
Exam 8: Taxes99 Questions
Exam 9: Global Markets in Action108 Questions
Exam 10: Externalities109 Questions
Exam 11: Public Goods and Common Resources66 Questions
Exam 12: Consumer Choice and Demand78 Questions
Exam 13: Production and Cost106 Questions
Exam 14: Perfect Competition105 Questions
Exam 15: Monopoly143 Questions
Exam 16: Monopolistic Competition82 Questions
Exam 17: Oligopoly71 Questions
Exam 18: Markets for Factors of Production74 Questions
Exam 19: Economic Inequality53 Questions
Select questions type
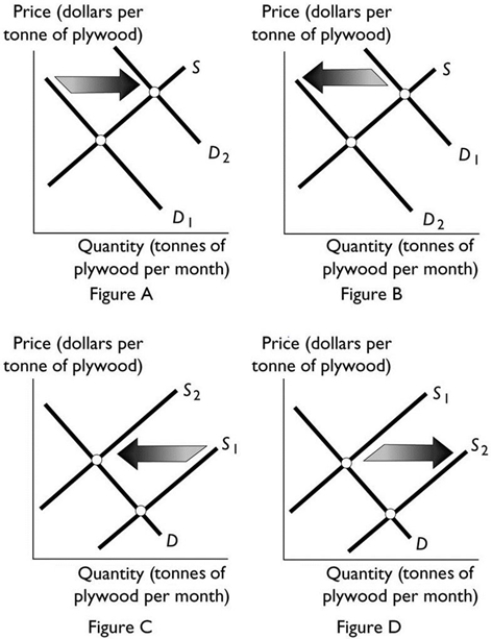 A construction boom occurs and many of the new buildings need plywood for their framing. Which of the figures above best illustrates this change?
(Multiple Choice)
4.8/5  (42)
(42)
It is expected that the price of a tonne of wheat will increase in one month. This belief will result in
(Multiple Choice)
4.8/5 (46)
Kiwi fruit and strawberries are substitutes for consumers. An increase in the price of a kiwi fruit coupled with an increase in the number of strawberry growers ________ the equilibrium price of a kilogram of strawberries and ________ the equilibrium quantity of strawberries.
(Multiple Choice)
4.8/5 (38)
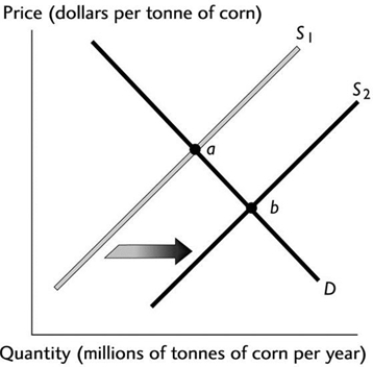 The above figure illustrates the market for corn. If point 'a' represents the original equilibrium and point 'b' the new equilibrium, which of the following could have caused the change?
(Multiple Choice)
4.8/5 (35)
For consumers, corn chips and salsa are complements. If the price of salsa rises, what is the effect on the equilibrium price and quantity of corn chips?
(Multiple Choice)
4.9/5 (41)
Using the data in the table above, at the price of $80 a phone,
(Multiple Choice)
4.9/5 (28)
Which of the following shifts the supply curve for oranges?
(Multiple Choice)
4.9/5 (40)
Suppose improvements in technology cause the supply of natural gas to increase and at the same time the demand for natural gas increases. What are we sure of?
(Multiple Choice)
4.9/5 (34)
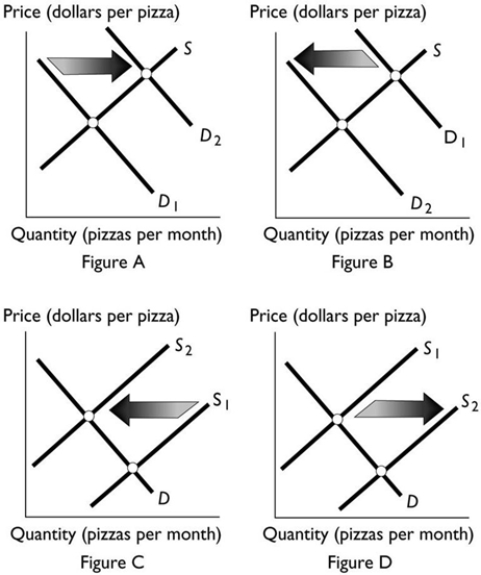 Which figure above shows the effect if research is published claiming that eating pizza is healthy?
(Multiple Choice)
4.8/5 (42)
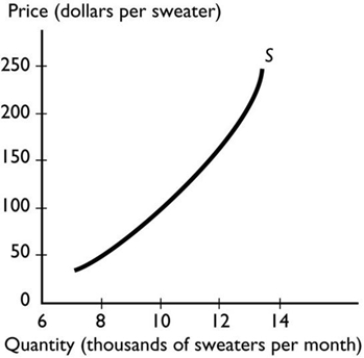 The graph illustrates the supply of sweaters. Which of the following events will increase the quantity supplied of sweaters?
(Multiple Choice)
4.8/5 (38)
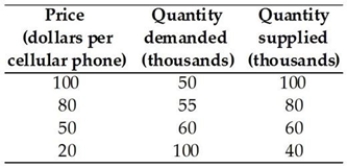 Using the data in the table above, the equilibrium quantity and equilibrium price for a cellular smart phone is
(Multiple Choice)
4.8/5 (38)
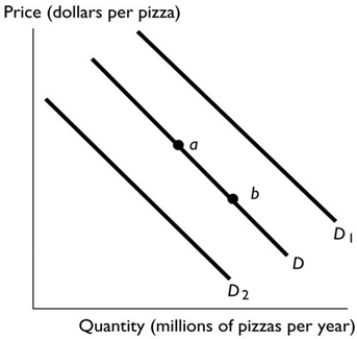 In the above figure, ________ will shift the demand curve from D to D1.
(Multiple Choice)
4.8/5 (40)
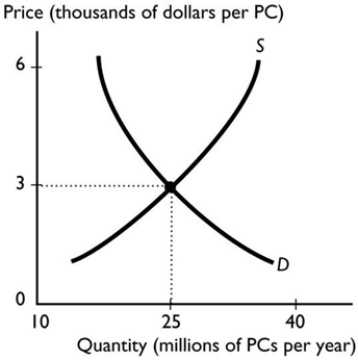 The graph illustrates the market for computers. If the number of buyers of computers increases and technology advances, you predict that the
(Multiple Choice)
4.9/5 (37)
What happens to the demand for a good if a complement's price increases?
(Multiple Choice)
4.7/5 (37)
Filters
- Essay(0)
- Multiple Choice(0)
- Short Answer(0)
- True False(0)
- Matching(0)