Exam 5: Theory of Consumer Behavior
Exam 1: Managers,profits,and Markets54 Questions
Exam 2: Demand,supply,and Market Equilibrium76 Questions
Exam 3: Marginal Analysis for Optimal Decisions98 Questions
Exam 4: Basic Estimation Techniques24 Questions
Exam 5: Theory of Consumer Behavior105 Questions
Exam 6: Elasticity and Demand76 Questions
Exam 7: Demand Estimation and Forecasting65 Questions
Exam 8: Production and Cost in the Short Run107 Questions
Exam 9: Production and Cost in the Long Run89 Questions
Exam 10: Production and Cost Estimation53 Questions
Exam 11: Managerial Decisions in Competitive Markets98 Questions
Exam 12: Managerial Decisions for Firms With Market Power112 Questions
Exam 13: Strategic Decision Making in Oligopoly Markets62 Questions
Exam 14: Advanced Pricing Techniques57 Questions
Exam 15: Decisions Under Risk and Uncertainty60 Questions
Exam 16: Government Regulation of Business50 Questions
Select questions type
The following figure shows a portion of a consumer's indifference map and budget lines.The price of good Y is $17 and the consumer's income is $7,650.Let the consumer begin in utility-maximizing equilibrium at point A on indifference curve II.Next the price of good X changes so that the consumer moves to a new utility-maximizing equilibrium at point B on indifference curve I.The substitution effect of the change in the price of X is 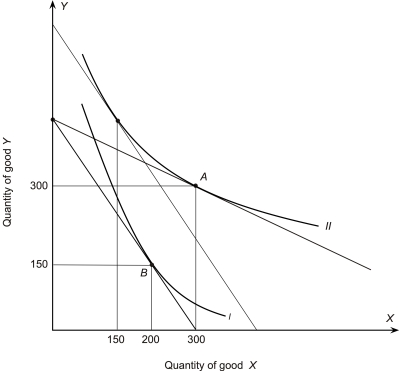
(Multiple Choice)
4.7/5  (35)
(35)
Lulu consumes only candy and cookies; she is currently buying more cookies than candy with her limited income.The last bag of candy gave Lulu the same additional utility as the last bag of cookies,and the prices of candy and cookies are the same.Lulu
(Multiple Choice)
4.8/5 (40)
The figure below shows a consumer maximizing utility at two different prices (the left panel)and the consumer's demand for good X at the same two prices of good X (the right panel).The price of good Y is $4.50.When the price of X increases from point S to point R along the demand curve,the substitution effect of the price increase is ________. 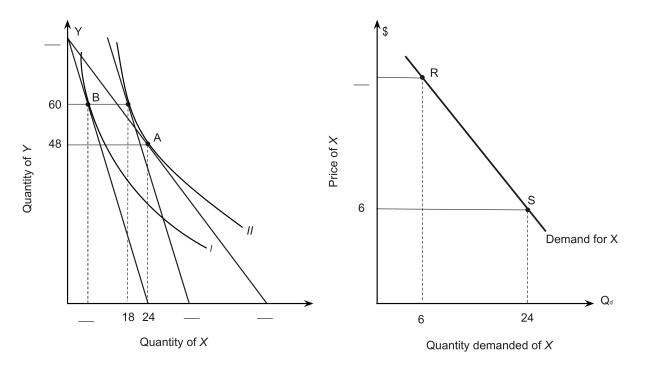
(Multiple Choice)
4.8/5 (47)
The figure below shows a consumer maximizing utility at two different prices (the left panel)and the consumer's demand for good X at the same two prices of good X (the right panel).The price of good Y is $14.When the price of X increases from point M to point N along the demand curve,the substitution effect of the price increase is ________. 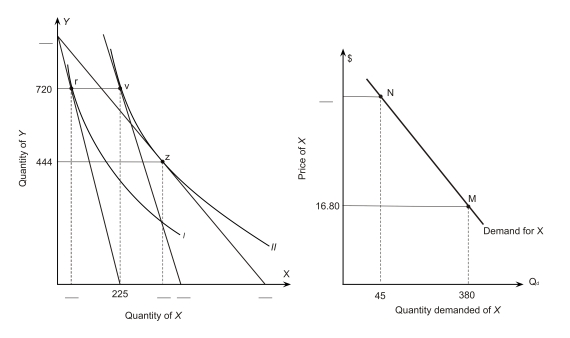
(Multiple Choice)
4.8/5 (44)
The figure below shows a consumer maximizing utility at two different prices (the left panel)and the consumer's demand for good X at the same two prices of good X (the right panel).The price of good Y is $4.50.When the price of X increases from point S to point R along the demand curve,the income effect of the price increase is ________. 
(Multiple Choice)
4.8/5 (35)
Filters
- Essay(0)
- Multiple Choice(0)
- Short Answer(0)
- True False(0)
- Matching(0)