Exam 5: Theory of Consumer Behavior
Exam 1: Managers,profits,and Markets54 Questions
Exam 2: Demand,supply,and Market Equilibrium76 Questions
Exam 3: Marginal Analysis for Optimal Decisions98 Questions
Exam 4: Basic Estimation Techniques24 Questions
Exam 5: Theory of Consumer Behavior105 Questions
Exam 6: Elasticity and Demand76 Questions
Exam 7: Demand Estimation and Forecasting65 Questions
Exam 8: Production and Cost in the Short Run107 Questions
Exam 9: Production and Cost in the Long Run89 Questions
Exam 10: Production and Cost Estimation53 Questions
Exam 11: Managerial Decisions in Competitive Markets98 Questions
Exam 12: Managerial Decisions for Firms With Market Power112 Questions
Exam 13: Strategic Decision Making in Oligopoly Markets62 Questions
Exam 14: Advanced Pricing Techniques57 Questions
Exam 15: Decisions Under Risk and Uncertainty60 Questions
Exam 16: Government Regulation of Business50 Questions
Select questions type
What is the equation for budget line RS,given the above graph?
(Multiple Choice)
4.9/5  (37)
(37)
A consumer has the indifference map shown below.The market prices of X and Y are $20 and $50,respectively.The consumer has $500 to spend on goods X and Y.For the utility-maximizing bundle,the marginal rate of substitution is ____________________ the slope of the budget line (in absolute value),and the ratio MU/P for good X is ____________ the ratio MU/P for good Y. 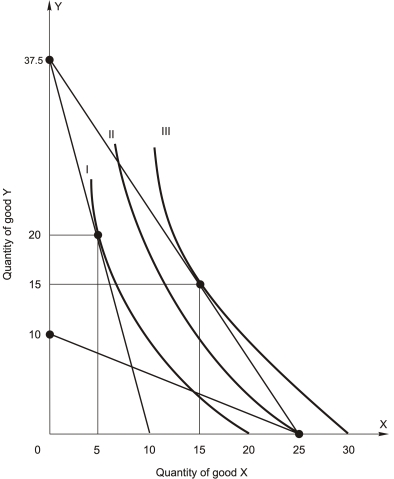
(Multiple Choice)
4.9/5 (36)
The figure below shows a consumer maximizing utility at two different prices (the left panel)and the consumer's demand for good X at the same two prices of good X (the right panel).The price of good Y is $14.At point N on the demand curve for X,the price of X is $____. 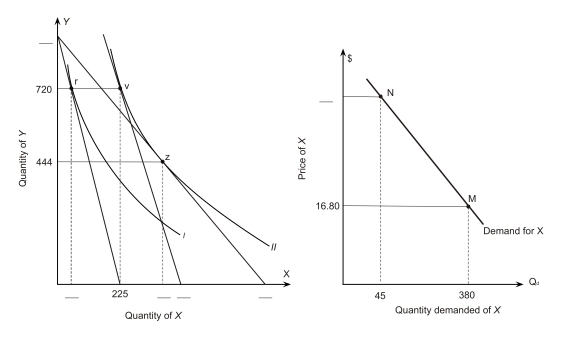
(Multiple Choice)
4.8/5 (41)
If a consumer is choosing the bundle of goods that maximizes utility subject to a budget constraint,then
(Multiple Choice)
4.8/5 (34)
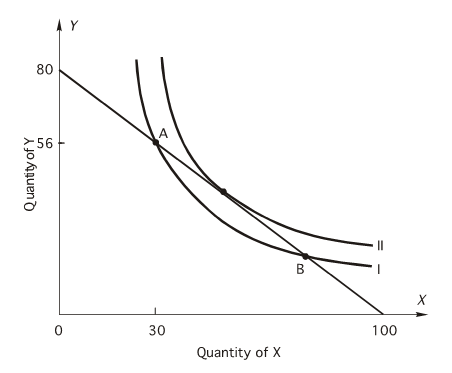 The consumer's income is $800.
-According to the above figure,why doesn't the consumer choose the combination of 30X and 56Y at point A?
The consumer's income is $800.
-According to the above figure,why doesn't the consumer choose the combination of 30X and 56Y at point A?
(Multiple Choice)
4.8/5 (42)
According to the following figure,what could have caused a consumer's budget line to shift from ML to MN? 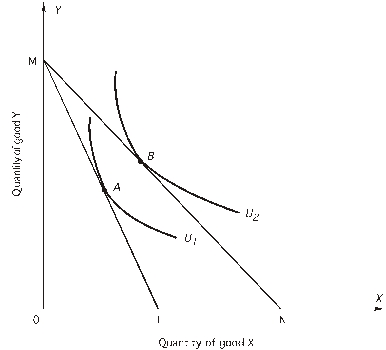
(Multiple Choice)
4.7/5 (31)
The figure below shows a consumer maximizing utility at two different prices (the left panel)and the consumer's demand for good X at the same two prices of good X (the right panel).The price of good Y is $14.The equation of the budget line passing through point r is _______________. 
(Multiple Choice)
4.8/5 (38)
Assume that an individual consumes two goods,X and Y.The total utility (assumed measurable)of each good is independent of the rate of consumption of other goods.The prices of X and Y are,respectively,$5 and $10. Units of the GOOd 1 2 3 4 5 6 7 8 Total Utility of X 50 95 135 170 200 225 245 160 Total Utility of y 400 750 950 1100 1220 1320 1400 1450
Given the above,if the consumer has $65 to spend on X and Y,the utility-maximizing bundle is
(Multiple Choice)
4.8/5 (37)
A consumer has the indifference map shown below.The market prices of X and Y are $20 and $12,respectively.The consumer has $1,000 to spend on goods X and Y.For the utility-maximizing bundle,the marginal rate of substitution is ____________________ the slope of the budget line (in absolute value),and the ratio MU/P for good X is ____________ the ratio MU/P for good Y. 
(Multiple Choice)
4.8/5 (43)
Suppose that 2 units of X and 8 units of Y give a consumer the same satisfaction as 4 units of X and 2 units of Y.Then
(Multiple Choice)
4.7/5 (40)
The figure below shows a consumer maximizing utility at two different prices (the left panel)and the consumer's demand for good X at the same two prices of good X (the right panel).The price of good Y is $14.What is the consumer's income? 
(Multiple Choice)
4.9/5 (38)
If Ferdinand prefers a Big Mac to a Whopper and a Whopper to a hotdog,but is indifferent between a Big Mac and a Quarter Pounder he must
(Multiple Choice)
4.7/5 (30)
The following figure shows a portion of a consumer's indifference map and budget lines.The price of good Y is $17 and the consumer's income is $7,650.Let the consumer begin in utility-maximizing equilibrium at point A on indifference curve II.Next the price of good X changes so that the consumer moves to a new utility-maximizing equilibrium at point B on indifference curve I.The total effect of the change in the price of X is 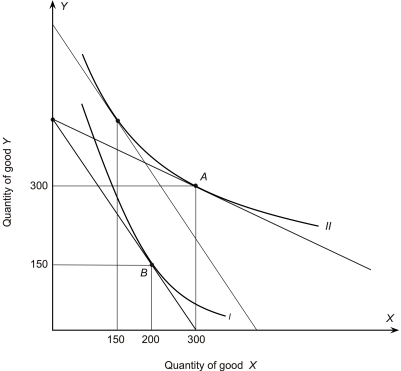
(Multiple Choice)
4.8/5 (35)
A consumer has the indifference map shown below.The market prices of X and Y are $20 and $12,respectively.The consumer has $1,000 to spend on goods X and Y.The utility-maximizing bundle is 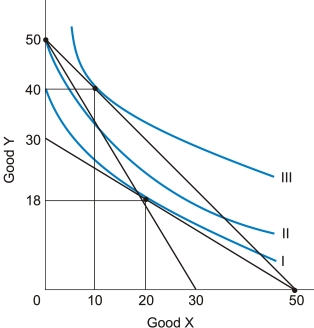
(Multiple Choice)
4.9/5 (34)
Refer to the following indifference map for a consumer who has an income of $48 to spend on goods X and Y and the market prices of X and Y are both $4: 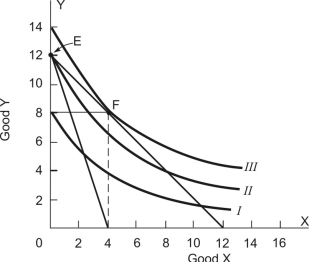 Now suppose the price of good X increases to $12 while the price of good Y remains $4.Utility will be maximized on which indifference curve?
(Multiple Choice)
4.9/5 (28)
Assume that an individual consumes two goods,X and Y.The total utility (assumed measurable)of each good is independent of the rate of consumption of other goods.The prices of X and Y are,respectively,$5 and $10. Units of the GOOd 1 2 3 4 5 6 7 8 Total Utility of X 50 95 135 170 200 225 245 160 Total Utility of y 400 750 950 1100 1220 1320 1400 1450
Given the above,if the consumer buys the third unit of Y,
(Multiple Choice)
4.8/5 (31)
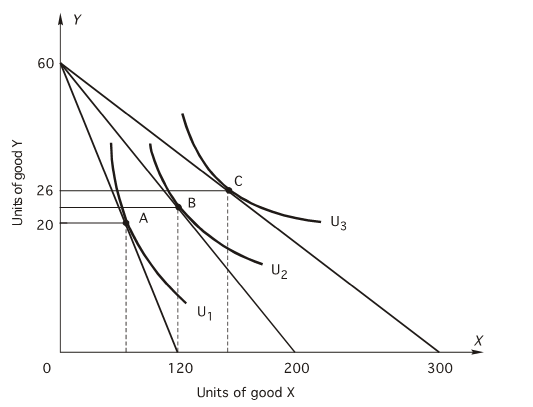 -According to the above figure,the marginal rate of substitution of X for Y at point C is:
(Multiple Choice)
4.9/5 (33)
The following figure shows a portion of a consumer's indifference map and budget lines.The price of good Y is $7 and the consumer's income is $700.Let the consumer begin in utility-maximizing equilibrium at point A on indifference curve I.Next the price of good X changes so that the consumer moves to a new utility-maximizing equilibrium at point B on indifference curve II.The income effect of the change in the price of X is 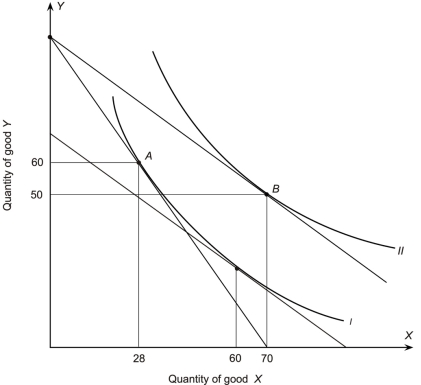
(Multiple Choice)
4.9/5 (41)
Filters
- Essay(0)
- Multiple Choice(0)
- Short Answer(0)
- True False(0)
- Matching(0)