Exam 5: Theory of Consumer Behavior
Exam 1: Managers,profits,and Markets54 Questions
Exam 2: Demand,supply,and Market Equilibrium76 Questions
Exam 3: Marginal Analysis for Optimal Decisions98 Questions
Exam 4: Basic Estimation Techniques24 Questions
Exam 5: Theory of Consumer Behavior105 Questions
Exam 6: Elasticity and Demand76 Questions
Exam 7: Demand Estimation and Forecasting65 Questions
Exam 8: Production and Cost in the Short Run107 Questions
Exam 9: Production and Cost in the Long Run89 Questions
Exam 10: Production and Cost Estimation53 Questions
Exam 11: Managerial Decisions in Competitive Markets98 Questions
Exam 12: Managerial Decisions for Firms With Market Power112 Questions
Exam 13: Strategic Decision Making in Oligopoly Markets62 Questions
Exam 14: Advanced Pricing Techniques57 Questions
Exam 15: Decisions Under Risk and Uncertainty60 Questions
Exam 16: Government Regulation of Business50 Questions
Select questions type
Alexandra consumes only caviar and champagne,but she does have a limited income of $400.Her current consumption choice is 5 ounces of caviar,at a price of $50 per ounce,and 6 bottles of champagne,at $25 each.The last ounce of caviar added 100 units to Alexandra's total utility,while the last bottle of champagne added 75 units.If Alexandra chooses 4 ounces of caviar and 8 bottles of champagne instead her total utility will:
(Multiple Choice)
4.9/5  (42)
(42)
The consumer chooses the bundle of goods that maximizes his utility and spends all his income.Which of the following statements is correct?
(Multiple Choice)
4.9/5 (28)
 -According to the above figure,which of the following are points on the consumer's demand curve for X?
(Multiple Choice)
4.7/5 (35)
In the following graph the consumer's income is $1,200.At what price of Y are Y2 units demanded? 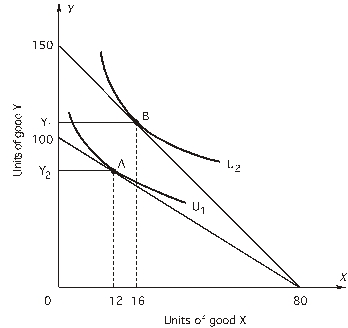
(Multiple Choice)
4.8/5 (31)
The price of X is $20 and the price of Y is $40.
 -Based on the above graph,if U1 is the highest level of utility the consumer can achieve,what is the consumer's income?
(Multiple Choice)
4.7/5 (33)
Suppose a consumer who purchases only two goods is making a utility-maximizing choice and then the price of one of the goods decreases.What will happen?
(Multiple Choice)
4.7/5 (27)
rate at which a consumer is ABLE to substitute one good for another is determined by
(Multiple Choice)
4.8/5 (31)
The figure below shows a consumer maximizing utility at two different prices (the left panel)and the consumer's demand for good X at the same two prices of good X (the right panel).The price of good Y is $14.When the price of X increases from point M to point N along the demand curve,$___________ of income must be temporarily given to the consumer to isolate the substitution effect. 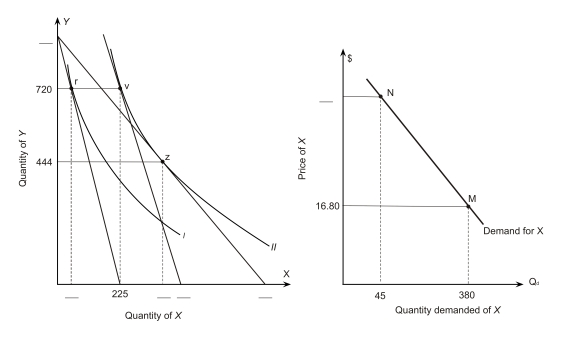
(Multiple Choice)
4.8/5 (44)
Which of the following assumptions is(are)NOT made in consumer behavior theory?
(Multiple Choice)
4.9/5 (29)
In a world with only two goods X and Y,which of the following statements is NOT true when a consumer faces a corner solution and spends all of her income on good X?
(Multiple Choice)
4.9/5 (40)
If the marginal rate of substitution of X for Y is 2,the price of X is $3,and the price of Y is $1,a utility-maximizing consumer should
(Multiple Choice)
4.8/5 (34)
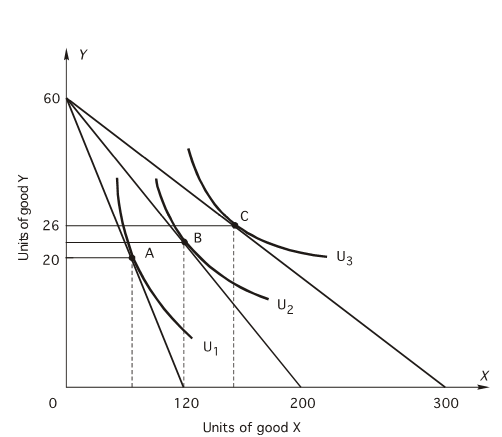
Based on the following graph,at point C, 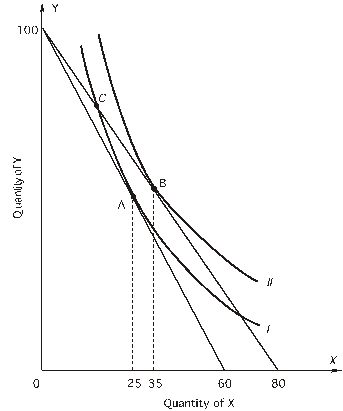 The consumer's income is $600.
(Multiple Choice)
4.8/5 (35)
A consumer has the indifference map shown below.The market prices of X and Y are $20 and $50,respectively.The consumer has $500 to spend on goods X and Y.The utility-maximizing bundle is 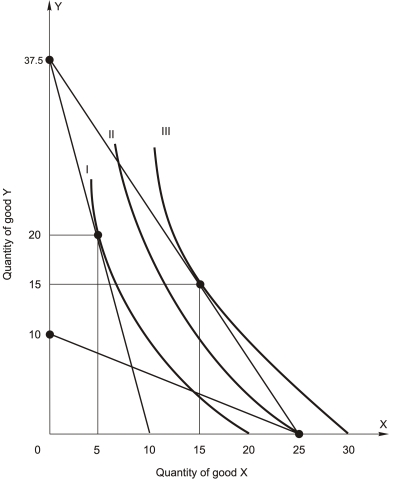
(Multiple Choice)
4.8/5 (36)
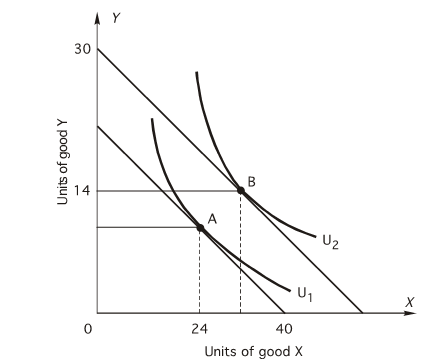
The following figure shows a portion of a consumer's indifference map and budget lines.The price of good Y is $7 and the consumer's income is $700.Let the consumer begin in utility-maximizing equilibrium at point A on indifference curve I.Next the price of good X changes so that the consumer moves to a new utility-maximizing equilibrium at point B on indifference curve II.The total effect of the change in the price of X is 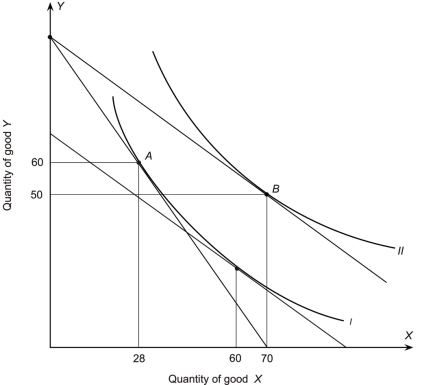
(Multiple Choice)
4.8/5 (30)
In the figure below,a consumer faces a market price of X equal to $3,a market price of Y equal to $3,and the consumer's budget is $90.In order for this consumer to choose the corner solution at point E,which of the following must occur? 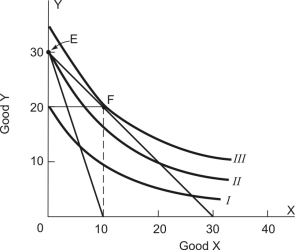
(Multiple Choice)
4.8/5 (35)
The figure below shows a consumer maximizing utility at two different prices (the left panel)and the consumer's demand for good X at the same two prices of good X (the right panel).The price of good Y is $4.50.When the price of X increases from point S to point R along the demand curve,$___________ of income must be temporarily given to the consumer to isolate the substitution effect. 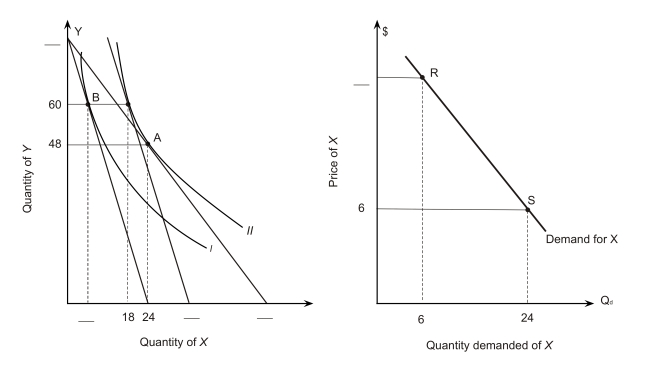
(Multiple Choice)
4.7/5 (41)
In the following graph the price of Y is $15.What does the curve in the lower graph show? 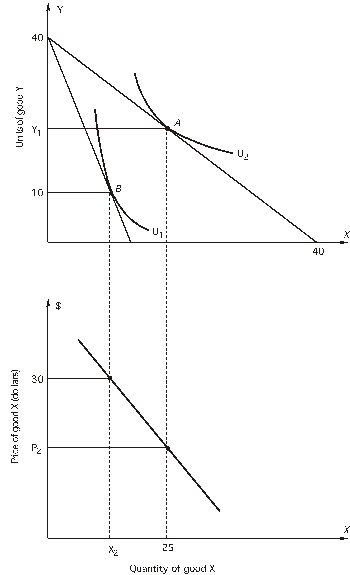
(Multiple Choice)
4.9/5 (40)
Filters
- Essay(0)
- Multiple Choice(0)
- Short Answer(0)
- True False(0)
- Matching(0)