Exam 5: Theory of Consumer Behavior
Exam 1: Managers,profits,and Markets54 Questions
Exam 2: Demand,supply,and Market Equilibrium76 Questions
Exam 3: Marginal Analysis for Optimal Decisions98 Questions
Exam 4: Basic Estimation Techniques24 Questions
Exam 5: Theory of Consumer Behavior105 Questions
Exam 6: Elasticity and Demand76 Questions
Exam 7: Demand Estimation and Forecasting65 Questions
Exam 8: Production and Cost in the Short Run107 Questions
Exam 9: Production and Cost in the Long Run89 Questions
Exam 10: Production and Cost Estimation53 Questions
Exam 11: Managerial Decisions in Competitive Markets98 Questions
Exam 12: Managerial Decisions for Firms With Market Power112 Questions
Exam 13: Strategic Decision Making in Oligopoly Markets62 Questions
Exam 14: Advanced Pricing Techniques57 Questions
Exam 15: Decisions Under Risk and Uncertainty60 Questions
Exam 16: Government Regulation of Business50 Questions
Select questions type
In the following graph the consumer's income is $1,200.What is Y1? 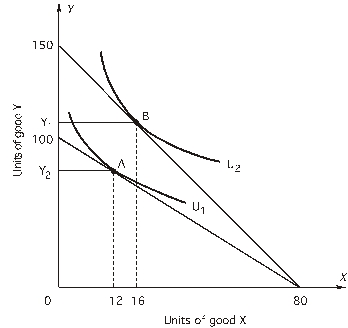
(Multiple Choice)
4.9/5  (39)
(39)
The figure below shows a consumer maximizing utility at two different prices (the left panel)and the consumer's demand for good X at the same two prices of good X (the right panel).The price of good Y is $4.50.When the price of X increases from point S to point R along the demand curve,the total effect of the price increase is ________. 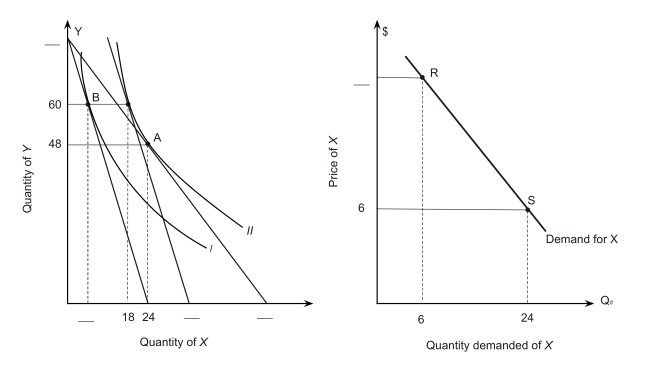
(Multiple Choice)
4.9/5 (44)
Ronald,who consumes only hamburgers and hot dogs,has a weekly income of $50.He is currently consuming 20 hamburgers,at a price of $2 each,and 10 hot dogs,at a price of $1 each.If the last hamburger and the last hot dog both added 50 units to Ronald's total utility,he
(Multiple Choice)
4.9/5 (39)
What is the equation for budget line LM,given in the above graph?
(Multiple Choice)
4.9/5 (39)
The price of X is $20 and the price of Y is $40.
 -Based on the above graph,at point B,
(Multiple Choice)
4.7/5 (39)
Ms.Birnbaum is buying bottles of beer and bags of pretzels.The marginal utility of the last bottle of beer is 60 and the marginal utility of the last bag of pretzels is 30.The price of beer is $0.30 per bottle and the price of pretzels is $0.20 per bag.Ms.Birnbaum
(Multiple Choice)
4.9/5 (34)
In the following graph the price of Y is $50.If U2 is the maximum attainable utility,the price of X is 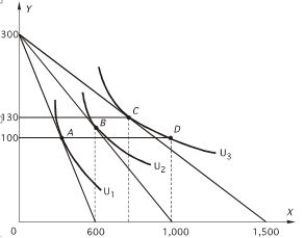
(Multiple Choice)
4.9/5 (45)
The following figure shows a portion of a consumer's indifference map and budget lines.The price of good Y is $7 and the consumer's income is $700.Let the consumer begin in utility-maximizing equilibrium at point A on indifference curve I.Next the price of good X changes so that the consumer moves to a new utility-maximizing equilibrium at point B on indifference curve II.Which of the following points are NOT points on this consumer's demand curve? 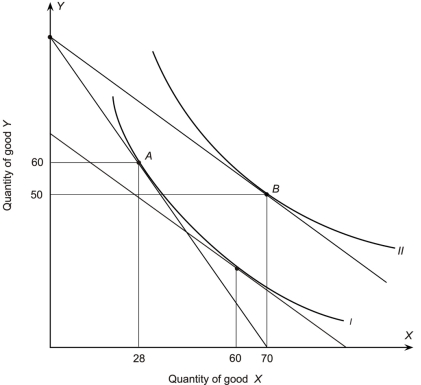
(Multiple Choice)
4.8/5 (38)
According to the Rolling Stones,"You can't always get what you want." Which does this mean in the context of utility maximization?
(Multiple Choice)
4.9/5 (38)
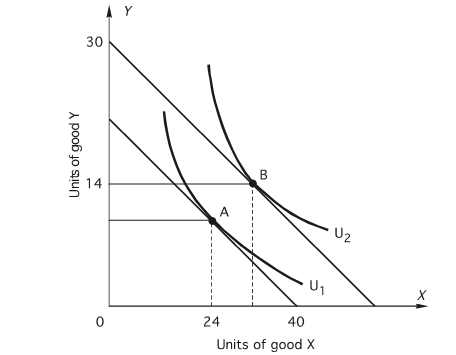
 The consumer's income is $800.
-According to the above figure,what is the consumer's marginal rate of substitution in equilibrium?
The consumer's income is $800.
-According to the above figure,what is the consumer's marginal rate of substitution in equilibrium?
(Multiple Choice)
4.7/5 (42)
In the following graph the price of Y is $50.The consumer's demand curve for X is 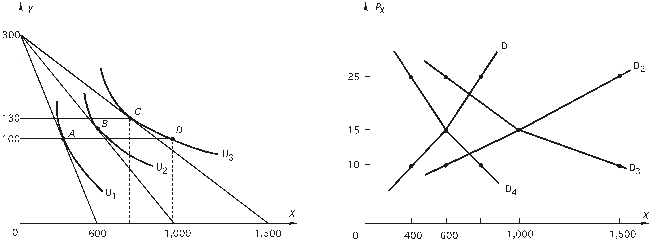
(Multiple Choice)
4.9/5 (41)
 The consumer's income is $800.
-According to the above figure,why doesn't the consumer choose the combination at point B?
The consumer's income is $800.
-According to the above figure,why doesn't the consumer choose the combination at point B?
(Multiple Choice)
4.9/5 (26)
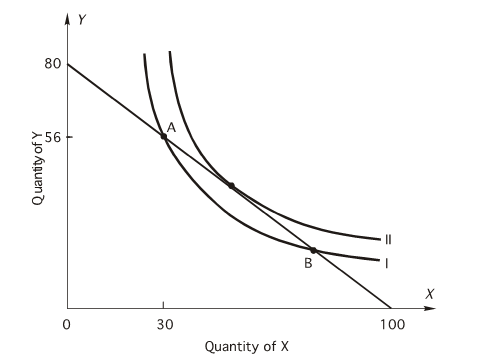
The following figure shows a portion of a consumer's indifference map and budget lines.The price of good Y is $17 and the consumer's income is $7,650.Let the consumer begin in utility-maximizing equilibrium at point A on indifference curve II.Next the price of good X changes so that the consumer moves to a new utility-maximizing equilibrium at point B on indifference curve I.Good X is a(an)___________ good but not a _________ good. 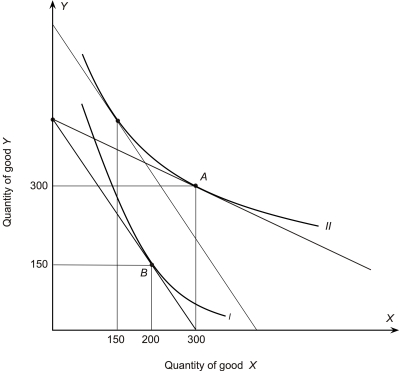
(Multiple Choice)
4.9/5 (33)
The following figure shows a portion of a consumer's indifference map and budget lines.The price of good Y is $17 and the consumer's income is $7,650.Let the consumer begin in utility-maximizing equilibrium at point A on indifference curve II.Next the price of good X changes so that the consumer moves to a new utility-maximizing equilibrium at point B on indifference curve I.Which of the following points are points on this consumer's demand curve? 
(Multiple Choice)
4.8/5 (33)
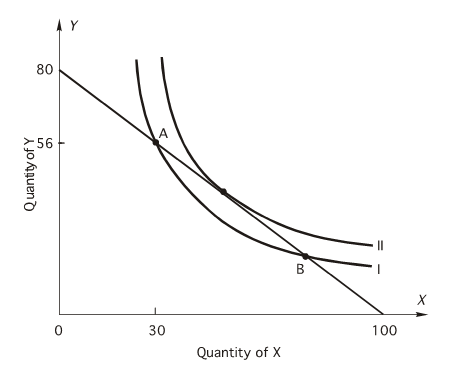
A consumer has the indifference map shown below.The market prices of X and Y are $20 and $12,respectively.The consumer has $1,000 to spend on goods X and Y.The utility-maximizing bundle ________ (is,is not)a corner solution because __________________. 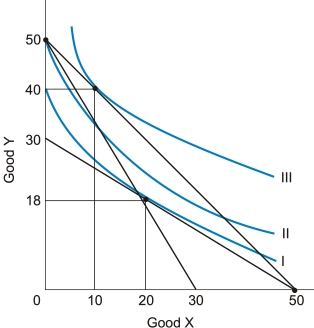
(Multiple Choice)
4.8/5 (35)
The price of X is $20 and the price of Y is $40.
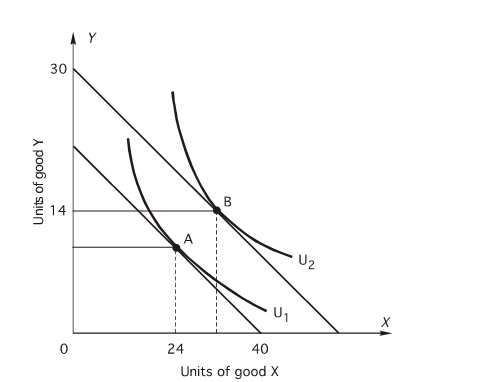 -Based on the above graph,if income is $800,how many units of Y will the consumer choose?
(Multiple Choice)
4.7/5 (37)
Filters
- Essay(0)
- Multiple Choice(0)
- Short Answer(0)
- True False(0)
- Matching(0)