Exam 6: Consumer Behaviour
Exam 1: Economic Issues and Concepts107 Questions
Exam 2: Economic Theories, Data, and Graphs114 Questions
Exam 3: Demand, Supply, and Price134 Questions
Exam 4: Elasticity124 Questions
Exam 5: Markets in Action114 Questions
Exam 6: Consumer Behaviour119 Questions
Exam 7: Producers in the Short Run120 Questions
Exam 8: Producers in the Long Run110 Questions
Exam 9: Competitive Markets125 Questions
Exam 10: Monopoly, Cartels, and Price Discrimination110 Questions
Exam 11: Imperfect Competition110 Questions
Exam 12: Economic Efficiency and Public Policy109 Questions
Exam 13: How Factor Markets Work123 Questions
Exam 14: Labour Markets92 Questions
Exam 15: Interest Rates and the Capital Market90 Questions
Exam 16: Market Failures and Government Intervention110 Questions
Exam 17: The Economics of Environmental Protection110 Questions
Exam 18: Taxation and Public Expenditure110 Questions
Exam 33: The Gains From International Trade112 Questions
Exam 34: Trade Policy114 Questions
Select questions type
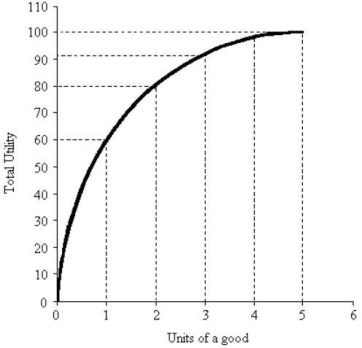 FIGURE 6- 1
-Refer to Figure 6- 1. The consumer's total utility is
FIGURE 6- 1
-Refer to Figure 6- 1. The consumer's total utility is
(Multiple Choice)
4.9/5  (40)
(40)
An equal proportional increase in money income and all money prices will
(Multiple Choice)
4.8/5 (34)
If money income is reduced by half, and the prices of all goods consumed by the household are reduced by half, the household's budget line will
(Multiple Choice)
4.8/5 (31)
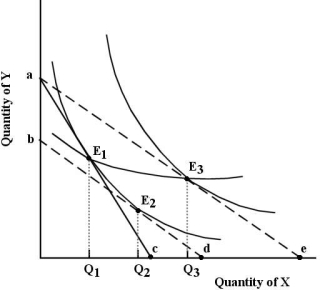 FIGURE 6- 10
-Refer to Figure 6- 10. The line joining points E1 and E3 is known as , which shows how
.
FIGURE 6- 10
-Refer to Figure 6- 10. The line joining points E1 and E3 is known as , which shows how
.
(Multiple Choice)
4.9/5 (29)
 FIGURE 6- 1
-Refer to Figure 6- 1. This figure illustrates the law of
FIGURE 6- 1
-Refer to Figure 6- 1. This figure illustrates the law of
(Multiple Choice)
4.9/5 (31)
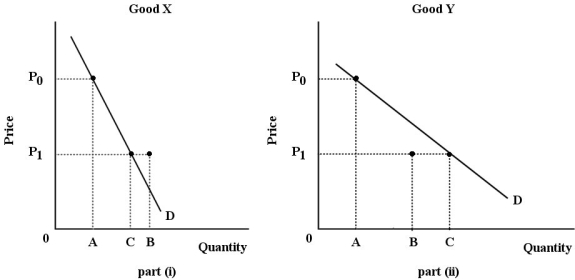 FIGURE 6- 3
-Refer to Figure 6- 3. For both goods, the price falls from P0 to P1. The substitution effect is illustrated by the change in quantity demanded from A to B; the income effect is illustrated by the change in quantity demanded from B to C. Good Y is certainly a(n) good.
FIGURE 6- 3
-Refer to Figure 6- 3. For both goods, the price falls from P0 to P1. The substitution effect is illustrated by the change in quantity demanded from A to B; the income effect is illustrated by the change in quantity demanded from B to C. Good Y is certainly a(n) good.
(Multiple Choice)
4.8/5 (40)
Suppose a utility- maximizing person consumes only two goods, hamburgers and milkshakes. Suppose the price of milkshakes rises and all other variables remain constant. As a result, this person will certainly
(Multiple Choice)
4.8/5 (36)
Given a particular market demand curve, consumer surplus is
(Multiple Choice)
4.9/5 (37)
Given a particular consumer's indifference map, the further the indifference curve is from the origin
(Multiple Choice)
4.8/5 (35)
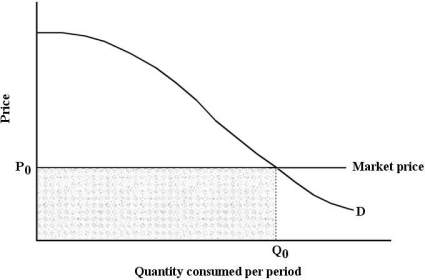 FIGURE 6- 6
-Refer to Figure 6- 6. Suppose that price is P0. The total value placed on all units of the commodity consumed is given by the area
FIGURE 6- 6
-Refer to Figure 6- 6. Suppose that price is P0. The total value placed on all units of the commodity consumed is given by the area
(Multiple Choice)
4.8/5 (27)
Given a typical downward- sloping demand curve in a market that has reached its equilibrium, the consumer surplus
(Multiple Choice)
4.8/5 (42)
The diagram below shows a set of budget lines facing a household. 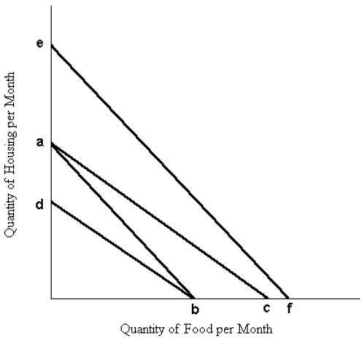 FIGURE 6- 7
-Refer to Figure 6- 7. The movement of the budget line from ab to db could be caused by
FIGURE 6- 7
-Refer to Figure 6- 7. The movement of the budget line from ab to db could be caused by
(Multiple Choice)
4.9/5 (30)
The figures below show Chris's consumption of specialty coffee per week. 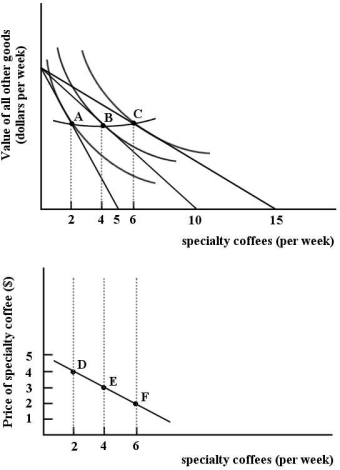 FIGURE 6- 9
-Refer to Figure 6- 9. The absolute value of the slope of the budget lines is equal to , which reflects the of specialty coffees in terms of all other goods.
FIGURE 6- 9
-Refer to Figure 6- 9. The absolute value of the slope of the budget lines is equal to , which reflects the of specialty coffees in terms of all other goods.
(Multiple Choice)
4.9/5 (38)
The figures below show Chris's consumption of specialty coffee per week.  FIGURE 6- 9
-Refer to Figure 6- 9. The two diagrams in Figure 6- 9 are showing
FIGURE 6- 9
-Refer to Figure 6- 9. The two diagrams in Figure 6- 9 are showing
(Multiple Choice)
4.8/5 (42)
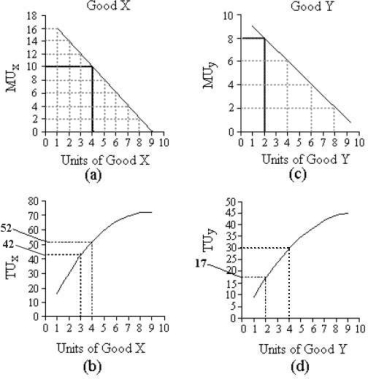 FIGURE 6- 2
-Refer to Figure 6- 2. If the price of X is $2 and the price of Y is $1 and the consumer is buying 4 units of X and 2 units of Y, the consumer's total utility is
FIGURE 6- 2
-Refer to Figure 6- 2. If the price of X is $2 and the price of Y is $1 and the consumer is buying 4 units of X and 2 units of Y, the consumer's total utility is
(Multiple Choice)
4.8/5 (41)
Since there is a limited supply of diamonds in the world, the consumption of diamonds
(Multiple Choice)
4.8/5 (36)
 FIGURE 6- 2
-Refer to Figure 6- 2. Suppose the price of Y is $1, the consumer's income is $10, and the consumer is currently buying 3 units of good X and 4 units of good Y. If this consumer is maximizing her utility, then the price of X must be
FIGURE 6- 2
-Refer to Figure 6- 2. Suppose the price of Y is $1, the consumer's income is $10, and the consumer is currently buying 3 units of good X and 4 units of good Y. If this consumer is maximizing her utility, then the price of X must be
(Multiple Choice)
4.9/5 (47)
The figures below show Chris's consumption of specialty coffee per week. FIGURE 6- 9
-Refer to Figure 6- 9. The line connecting points A, B and C is _ . The line connecting points D, E and F is .
(Multiple Choice)
4.8/5 (39)
Units Marginal Utility Total Utility Marginal Total Utility Utility 1 10 10 12 12 2 8 18 10 22 3 5 23 7 29 4 3 26 5 34 5 1 27 2 36 6 0 27 1 37 7 0 27 0 27
-Refer to Table 6- 1. If the price of toffee bars is $1 each, bags of cashews are $2 each, and this consumer has $7 per week to spend on these two snacks, how many of each will he/she purchase to maximize utility?
(Multiple Choice)
4.8/5 (39)
Filters
- Essay(0)
- Multiple Choice(0)
- Short Answer(0)
- True False(0)
- Matching(0)