Exam 19: Decision Theory
Exam 1: An Introduction to Business Statistics and Analytics98 Questions
Exam 2: Descriptive Statistics and Analytics: Tabular and Graphical Methods120 Questions
Exam 3: Descriptive Statistics and Analytics: Numerical Methods145 Questions
Exam 4: Probability and Probability Models150 Questions
Exam 5: Predictive Analytics I: Trees, K-Nearest Neighbors, Naive Bayes,101 Questions
Exam 6: Discrete Random Variables150 Questions
Exam 7: Continuous Random Variables150 Questions
Exam 8: Sampling Distributions111 Questions
Exam 9: Confidence Intervals149 Questions
Exam 10: Hypothesis Testing150 Questions
Exam 11: Statistical Inferences Based on Two Samples140 Questions
Exam 12: Experimental Design and Analysis of Variance132 Questions
Exam 13: Chi-Square Tests120 Questions
Exam 14: Simple Linear Regression Analysis147 Questions
Exam 15: Multiple Regression and Model Building85 Questions
Exam 16: Predictive Analytics Ii: Logistic Regression, Discriminate Analysis,101 Questions
Exam 17: Time Series Forecasting and Index Numbers161 Questions
Exam 18: Nonparametric Methods103 Questions
Exam 19: Decision Theory90 Questions
Select questions type
An automobile insurance company is in the process of reviewing its policies. The company is considering increasing the premium charged to drivers under 25. According to company records, 35 percent of the insured drivers are under the age of 25. Company records also show that 280 of the 700 insured drivers under the age of 25 have been involved in at least one automobile accident. On the other hand, only 130 of the 1300 insured drivers 25 years or older have been involved in at least one automobile accident. What is the probability that an insured driver of any age will be involved in an accident?
(Multiple Choice)
4.8/5  (44)
(44)
Alternatives 1 and 2 in the following payoff table represent the two possible manufacturing strategies that the EKA manufacturing company can adopt. The level of demand affects the success of both strategies. The states of nature (SI) represent the levels of demand for the company products. S1, S2, and S3 characterize high, medium, and low demand, respectively. The payoff values are in thousands of dollars.
 The management believes that weather conditions significantly affect the level of demand. 48 monthly sales reports are randomly selected. These monthly sales reports show 15 months with high demand, 28 months with medium demand, and 5 months with low demand. 12 of the 15 months with high demand had favorable weather conditions. 14 of the 28 months with medium demand had favorable weather conditions. Only 1 of the 5 months with low demand had favorable weather conditions. Based on this information, the prior probabilities have been revised. If the weather conditions are favorable, P(S1) = .4286, P(S2) = .5357, and P(S3) = .0357; and if the weather conditions are poor, P(S1) = .1364, P(S2) = .6818, and P(S3) = .1818. It is also determined that the probability of favorable weather is .56 and the probability of poor weather is .44.
Carry out a preposterior analysis and, using the revised probabilities, determine (1) the expected monetary value when the weather conditions are favorable and (2) the expected monetary value when the weather conditions are poor.
The management believes that weather conditions significantly affect the level of demand. 48 monthly sales reports are randomly selected. These monthly sales reports show 15 months with high demand, 28 months with medium demand, and 5 months with low demand. 12 of the 15 months with high demand had favorable weather conditions. 14 of the 28 months with medium demand had favorable weather conditions. Only 1 of the 5 months with low demand had favorable weather conditions. Based on this information, the prior probabilities have been revised. If the weather conditions are favorable, P(S1) = .4286, P(S2) = .5357, and P(S3) = .0357; and if the weather conditions are poor, P(S1) = .1364, P(S2) = .6818, and P(S3) = .1818. It is also determined that the probability of favorable weather is .56 and the probability of poor weather is .44.
Carry out a preposterior analysis and, using the revised probabilities, determine (1) the expected monetary value when the weather conditions are favorable and (2) the expected monetary value when the weather conditions are poor.
(Short Answer)
4.8/5 (30)
The maximin criterion finds the best possible payoff for each alternative and then chooses the alternative that yields the maximum payoff.
(True/False)
4.8/5 (29)
A company wants to add a new product to its existing line of products. There are two similar candidate products, A and B. The demand for the new product could be high, medium, or low, with probabilities of .25, .5, and .25, respectively. The demand and the corresponding profit for each product are shown below.
 Which product should the company select based on the expected monetary value criterion?
(Short Answer)
4.9/5 (38)
When making a decision in an environment of ________, the decision maker knows which of the states of nature will actually occur.
(Multiple Choice)
4.8/5 (41)
The ________ criterion finds the worst-possible payoff for each alternative and then chooses the alternative that yields the maximum worst-possible payoff.
(Multiple Choice)
4.7/5 (34)
A ________ is a diagram that assists the decision maker in analyzing a decision problem.
(Multiple Choice)
4.9/5 (39)
A tire manufacturer needs to choose the production level for the coming month (high vs. low). The level of production largely depends on the level of demand. For this situation, the level of demand (high, medium, low) is the state of nature.
(True/False)
4.9/5 (31)
The maximax criterion finds the best possible payoff for each alternative and then chooses the alternative that yields the maximum (best) possible payoff.
(True/False)
4.8/5 (34)
A pharmaceutical company manufacturing flu test kits wants to determine the probability of a teenager not having the flu when the test results indicate that they do (false positive). It is estimated that the probability of a positive test for flu among potential users of the kit is 10 percent. According to the company laboratory test results, 1 out of 100 noninfected teenagers tested as having the flu (false positive). On the other hand, 1 out of 200 teenagers with the flu tested as not having the active virus (false negative). A teenager has just used the flu test kit manufactured by the company, and the results showed she has the flu. What is the probability that she does not have the flu?
(Multiple Choice)
4.7/5 (34)
The quality control manager for NKA Inc. must decide whether to accept (alternative 1), further analyze (alternative 2), or reject (alternative 3) an incoming shipment (lot) of microchips. The historical data indicate that there is a 30 percent chance that the lot is poor quality (S1), 50 percent chance that the lot is fair quality (S2), and 20 percent chance that the lot is good quality (S3). Assume the following payoff table is available. The values in the payoff table are in thousands of dollars.
 Bf the lot is poor quality, 40 percent of the items are defective. If the lot is fair quality, 22 percent of the items are defective. If the lot is good quality, 10 percent of the items are defective. The quality control manager inspects one unit from a recent shipment. After inspecting it, he determines that the unit is defective. Given that the inspected item is defective, determine which alternative action the quality control manager should choose.
(Short Answer)
4.7/5 (47)
The utility curve given below represents the preferences of a ________ decision maker. 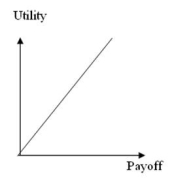
(Multiple Choice)
4.9/5 (37)
The utility curve given below represents the preferences of a ________ decision maker. 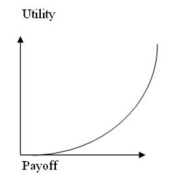
(Multiple Choice)
4.9/5 (42)
The ________ criterion finds the best-possible payoff for each alternative and then chooses the alternative that yields the maximum best-possible payoff.
(Multiple Choice)
4.7/5 (35)
When we assess the worth of sample information in a decision-making problem, we are performing a(n) ________ analysis.
(Multiple Choice)
4.8/5 (39)
In utility analysis, a utility curve that shows a rapid increase in utility for initial amounts of money followed by a gradual leveling off for larger amounts of money is appropriate for a risk-seeking decision maker.
(True/False)
4.8/5 (35)
The expected value criterion is used for decision making under ________.
(Multiple Choice)
4.9/5 (41)
The alternatives 1 and 2 in the following payoff table represent the two possible manufacturing strategies that the EKA manufacturing company can adopt. The level of demand affects the success of both strategies. The states of nature (SI) represent the levels of demand for the company products. s1, s2, and s3 characterize high, medium, and low demand, respectively. The payoff values are in thousands of dollars. Prior probabilities are .3 for s1; .6 for s2, and .1 for s3.
 Find the expected monetary value for each of the alternatives and determine the best alternative (course of action) for the EKA manufacturing company using the expected monetary value criterion.
(Short Answer)
4.7/5 (40)
Alternatives 1 and 2 in the following payoff table represent the two possible manufacturing strategies that the EKA manufacturing company can adopt. The level of demand affects the success of both strategies. The states of nature (SI) represent the levels of demand for the company products. S1, S2, and S3 characterize high, medium, and low demand, with probabilities of .3, .6, and .1, respectively. The payoff values are in thousands of dollars.  The management believes that weather conditions significantly affect the level of demand. 48 monthly sales reports are randomly selected. These monthly sales reports show 15 months with high demand, 28 months with medium demand, and 5 months with low demand. 12 of the 15 months with high demand had favorable weather conditions. 14 of the 28 months with medium demand had favorable weather conditions. Only 1 of the 5 months with low demand had favorable weather conditions. What is the probability that weather conditions are poor, given that the demand is high?
(Multiple Choice)
4.8/5 (34)
Alternatives 1 and 2 in the following payoff table represent the two possible manufacturing strategies that the EKA manufacturing company can adopt. The level of demand affects the success of both strategies. The states of nature (SI) represent the levels of demand for the company products. S1, S2, and S3 characterize high, medium, and low demand, with probabilities of .3, .6, and .1, respectively. The payoff values are in thousands of dollars.  The management believes that the weather conditions significantly affect the level of demand. 48 monthly sales reports are randomly selected. These monthly sales reports show 15 months with high demand, 28 months with medium demand, and 5 months with low demand. 12 of the 15 months with high demand had favorable weather conditions. 14 of the 28 months with medium demand had favorable weather conditions. Only 1 of the 5 months with low demand had favorable weather conditions. What is the maximum amount that the company would be willing to pay for perfect information?
(Multiple Choice)
4.8/5 (38)
Filters
- Essay(0)
- Multiple Choice(0)
- Short Answer(0)
- True False(0)
- Matching(0)