Exam 3: Descriptive Statistics and Analytics: Numerical Methods
Exam 1: An Introduction to Business Statistics and Analytics98 Questions
Exam 2: Descriptive Statistics and Analytics: Tabular and Graphical Methods120 Questions
Exam 3: Descriptive Statistics and Analytics: Numerical Methods145 Questions
Exam 4: Probability and Probability Models150 Questions
Exam 5: Predictive Analytics I: Trees, K-Nearest Neighbors, Naive Bayes,101 Questions
Exam 6: Discrete Random Variables150 Questions
Exam 7: Continuous Random Variables150 Questions
Exam 8: Sampling Distributions111 Questions
Exam 9: Confidence Intervals149 Questions
Exam 10: Hypothesis Testing150 Questions
Exam 11: Statistical Inferences Based on Two Samples140 Questions
Exam 12: Experimental Design and Analysis of Variance132 Questions
Exam 13: Chi-Square Tests120 Questions
Exam 14: Simple Linear Regression Analysis147 Questions
Exam 15: Multiple Regression and Model Building85 Questions
Exam 16: Predictive Analytics Ii: Logistic Regression, Discriminate Analysis,101 Questions
Exam 17: Time Series Forecasting and Index Numbers161 Questions
Exam 18: Nonparametric Methods103 Questions
Exam 19: Decision Theory90 Questions
Select questions type
According to a survey of the top 10 employers in a major city in the Midwest, a worker spends an average of 413 minutes a day on the job. Suppose the standard deviation is 26.8 minutes and the time spent is approximately a normal distribution. What are the times within which approximately 99.73 percent of all workers will fall?
(Multiple Choice)
4.8/5  (40)
(40)
In a statistics class, 10 scores were randomly selected with the following results: 74, 73, 77, 77, 71, 68, 65, 77, 67, 66. What is the IQR?
(Multiple Choice)
4.8/5 (46)
The following table shows the Price-to-Earnings ratio for a stereo equipment manufacturing company between 1998 and 2002.  Determine the percentage change in the P/E ratios from 1998 to 1999.
(Multiple Choice)
4.9/5 (31)
In the calculation of a mean for grouped data, we assume that the average of the measurements in each class equals the class midpoint.
(True/False)
4.7/5 (39)
In a statistics class, 10 scores were randomly selected with the following results (mean = 71.5): 74, 73, 77, 77, 71, 68, 65, 77, 67, 66. What is the standard deviation?
(Multiple Choice)
4.8/5 (37)
The pth percentile is a value such that (100 − p) percent of the measurements fall at or below the value.
(True/False)
4.9/5 (39)
The local amusement park was interested in the average wait time at their most popular roller coaster at the peak park time (2 p.m.). They selected 13 patrons and had them get in line between 2 and 3 p.m. Each was given a stopwatch to record the time they spent in line. The times recorded were as follows (in minutes). 118, 124, 108, 116, 99, 120, 148, 118, 119, 121, 45, 130, 118
What is the first quartile?
(Multiple Choice)
4.7/5 (33)
A measurement located outside the upper limits of a box-and-whiskers display is ________.
(Multiple Choice)
4.8/5 (33)
In a statistics class, 10 scores were randomly selected with the following results (mean = 71.5): 74, 73, 77, 77, 71, 68, 65, 77, 67, 66. What is the range?
(Multiple Choice)
4.7/5 (40)
The ________ is a quantity that measures the variation of a population or sample relative to its mean.
(Multiple Choice)
4.8/5 (32)
An initial investment of $10,000 has a value of $7,382 at the end of year 1. What is the rate of return for the first year?
(Short Answer)
4.7/5 (35)
Using Chebyshev's theorem, approximate the minimum proportion of the data that will be within μ ± kσ for k = 3.2.
(Multiple Choice)
4.8/5 (39)
In the calculation of a mean for grouped data, ________ are used.
(Multiple Choice)
4.9/5 (44)
Find the weighted mean per capita income for the following random sample of six cities in the Midwest.

(Short Answer)
4.7/5 (28)
The population variance is the average of the squared deviations of the individual population measurements from the population mean.
(True/False)
5.0/5 (39)
The following frequency table summarizes the ages of 60 shoppers at the local grocery store. 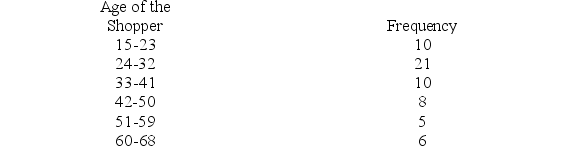 The sample mean for the above frequency table is calculated as 36.25. Calculate the approximate sample standard deviation for this data set.
(Multiple Choice)
5.0/5 (33)
Quality control is an important issue at ACME Company, which manufactures light bulbs. To test the life-hours of their light bulbs, they randomly sampled nine light bulbs and measured how many hours they lasted: 378, 361, 350, 375, 200, 391, 375, 368, 321. What is the median?
(Multiple Choice)
4.8/5 (37)
In a hearing test, randomly selected subjects estimate the loudness (in decibels) of a sound, and the results are (mean = 70): 68, 67, 70, 71, 68, 75, 68, 62, 80, 73, 68. What is the variance?
(Multiple Choice)
4.9/5 (36)
Filters
- Essay(0)
- Multiple Choice(0)
- Short Answer(0)
- True False(0)
- Matching(0)