Exam 7: Beyond Alleles: Quantitative Genetics and the Evolution of Phenotypes
Exam 1: The Whale and the Virus: How Scientists Study Evolution37 Questions
Exam 2: From Natural Philosophy to Darwin: a Brief History of Evolutionary Ideas42 Questions
Exam 3: What the Rocks Say: How Geology and Paleontology Reveal the History of Life84 Questions
Exam 4: The Tree of Life: How Biologists Use Phylogeny to Reconstruct the Deep Past42 Questions
Exam 5: Raw Material: Heritable Variation Among Individuals51 Questions
Exam 6: The Ways of Change: Drift and Selection71 Questions
Exam 7: Beyond Alleles: Quantitative Genetics and the Evolution of Phenotypes42 Questions
Exam 8: The History in Our Genes65 Questions
Exam 9: From Genes to Traits: the Evolution of Genetic Networks and Development67 Questions
Exam 10: Natural Selection: Empirical Studies in the Wild40 Questions
Exam 11: Sex: Causes and Consequences43 Questions
Exam 12: After Conception: the Evolution of Life History and Parental Care43 Questions
Exam 13: The Origin of Species48 Questions
Exam 14: Macroevolution: the Long Run57 Questions
Exam 15: Intimate Partnerships: How Species Adapt to Each Other39 Questions
Exam 16: Brains and Behavior60 Questions
Exam 17: Human Evolution: a New Kind of Ape70 Questions
Exam 18: Evolutionary Medicine70 Questions
Select questions type
The genetic component of variance for narrow sense heritability includes
(Multiple Choice)
4.7/5  (42)
(42)
Stalk-eyed flies are so named because their eyes are situated at the end of long stalks extending away from their head. Stalk length is a quantitative trait that is variable in populations. Describe the steps you would need to take in order to find quantitative trait loci linked to differences in eye stalk length.
(Essay)
4.8/5 (36)
Given the warming climate, you are interested in how seed production of a certain plant species is affected by temperature. In particular, you are interested in whether seed production shows a plastic response to temperature and, if so, whether there is the possibility for adaptive evolution of phenotypic plasticity in response to climate change. Please describe the steps that would be needed to demonstrate that there is the capacity for adaptive evolution in the population you are studying.
(Essay)
4.9/5 (42)
As a result of warming climate, most butterfly species in California mature 24 days sooner than they did 30 years ago.
(a) Please describe a scenario that would account for this change through phenotypic plasticity.
(b) Please describe a scenario that would account for this change through evolution by natural selection.
(Essay)
4.9/5 (35)
Which of the following scenarios best describes how you would study reaction norms?
(Multiple Choice)
4.9/5 (42)
The greyhound is a dog breed known for its amazing speed. This breed was produced by taking the fastest animals and breeding them together, generation after generation. Though artificial, this is an example of __________.
(Multiple Choice)
4.8/5 (39)
Scientists studying a species of fish using quantitative trait locus analysis found that fishes with paternal alleles at a marker have larger body sizes than fishes with maternal alleles at the marker. This suggests that
(Multiple Choice)
4.9/5 (34)
Each graph below depicts reaction norms for three different genotypes reared in different environments. In which case(s) is/are there a capacity for phenotypic plasticity to further evolve (you can assume that graphs for parents and their offspring would be the same)? Explain your answer. 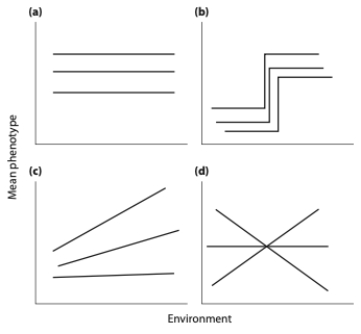
(Not Answered)
This question doesn't have any answer yet
If A1 represents an allele at one locus and B1 represents an allele at another locus, which equation represents linkage disequilibrium?
(Multiple Choice)
4.8/5 (40)
The total variance in a phenotypic trait in a population (VP ) is accurately expressed as
(Multiple Choice)
4.8/5 (44)
Each graph below shows the phenotype produced by three different genotypes in different environmental conditions (each line is a genotype). For each graph write "plasticity" or "no plasticity" depending on whether the graph depicts phenotypic plasticity. Also, write "G × E" or "no G × E" depending on whether the graph depicts a genotype by environment interaction. 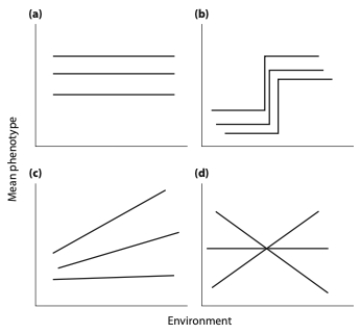
(Not Answered)
This question doesn't have any answer yet
You are studying the effect of directional selection on body height in three populations (a, b, and c) below. 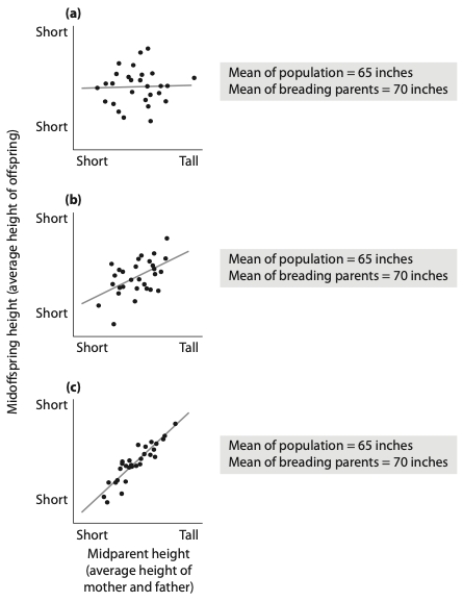 (a) What is the selection differential? Show your calculation.
(b) Which population has the highest narrow sense heritability for height? Explain your answer.
(c) If you examined the offspring in the next generation in each population, which population would have the highest mean height? Why?
(a) What is the selection differential? Show your calculation.
(b) Which population has the highest narrow sense heritability for height? Explain your answer.
(c) If you examined the offspring in the next generation in each population, which population would have the highest mean height? Why?
(Not Answered)
This question doesn't have any answer yet
The residues ("tailings") of mines often contain such high concentrations of toxic metals (e.g., copper, lead) that most plants are unable to grow on them. However, some hardy species (e.g., certain grasses) are able to spread from the surrounding uncontaminated soil into such areas. These plants evolve resistance to the toxic metals, while their ability to grow on uncontaminated soil decreases. Because grasses are wind pollinated, breeding between the resistant and nonresistant populations continues, but offspring of crosses between the two populations are intermediate and have low fitness. This is an example of
(Multiple Choice)
4.9/5 (33)
The selection differential for a quantitative trait is ____________. Assuming heritability is the same in all cases, a larger selection differential ___________.
(Multiple Choice)
4.7/5 (37)
Agree or disagree with the following statement and explain your answer: If a trait such as height has high narrow sense heritability (say 0.7), this means that genetics is more important than environment in determining the height of any given individual.
(Essay)
4.9/5 (29)
How is linkage disequilibrium used as a tool for determining the genetic basis of complex phenotypic traits?
(Essay)
4.9/5 (30)
Filters
- Essay(0)
- Multiple Choice(0)
- Short Answer(0)
- True False(0)
- Matching(0)