Exam 10: Statistical Thinking And Applications
Exam 1: Introduction126 Questions
Exam 2: Total Quality In Organizations105 Questions
Exam 3: Philosophies And Frameworks130 Questions
Exam 4: Strategic Focus For Performance Excellence104 Questions
Exam 5: Focusing On Customers97 Questions
Exam 6: High Performance Workforce Management109 Questions
Exam 7: Process Management98 Questions
Exam 8: Performance Measurement And Information Management129 Questions
Exam 9: Leading, building, and Sustaining Performance Excellence107 Questions
Exam 10: Statistical Thinking And Applications97 Questions
Exam 11: Six Sigma And Process Improvement78 Questions
Exam 12: Design For Quality And Product Excellence104 Questions
Exam 13: Statistical Process Control100 Questions
Select questions type
A system governed only by common cause variation is a system that:
(Multiple Choice)
4.8/5  (33)
(33)
All else being equal,as the confidence interval increases,the confidence level increases.
(True/False)
4.7/5 (30)
Deming's Funnel Experiment illustrates that people can and do create unwanted process variation by indiscriminately trying to remove common-cause variation.
(True/False)
4.9/5 (33)
According to Deming,the analysis of a static population is called:
(Multiple Choice)
4.8/5 (35)
An experiment that evaluates the effect of two temperatures (200 and 400 degrees)and two reaction times (50 and 100 minutes)on process yield has ___ possible combinations to test.
(Multiple Choice)
4.8/5 (35)
_____ arise from external sources that are not inherent in the process.
(Multiple Choice)
4.9/5 (43)
Which of the following requires the opinion of an expert to determine the location and characteristics of a definable sample group?
(Multiple Choice)
4.9/5 (35)
Exhibit 10-1
In an audit of the outstanding bills in a large multi-national firm, the auditor selected a random sample of 40 of these bills and recorded the dollar value of each outstanding bill.The data were analyzed using Excel (see below).
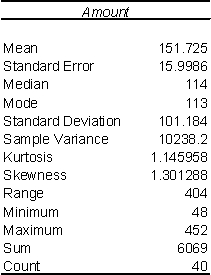 -Refer to Exhibit 10-1.Suppose the auditor wants to test,at a 1% significance level,the null hypothesis that the population mean dollar value of the outstanding bills is equal to 130.0 versus the alternative null hypothesis that the population mean dollar value of the outstanding bills is not equal to 130.0.The auditor:
(Multiple Choice)
5.0/5 (28)
As the risks associated with making an incorrect conclusion cannot be quantified in the case of a non-random sample,_____ sampling is not a preferred method of sampling.
(Multiple Choice)
4.8/5 (26)
A quality engineer in a light bulb factory is planning a study to estimate the average life of a large shipment of light bulbs.The engineer wants to estimate the average life within plus or minus 15 hours with 95 percent confidence.Assuming a process standard deviation of 100 hours,determine the sample size for this study.
(Multiple Choice)
4.9/5 (40)
A manager was assigned the task of investigating the error in payments for routine purchases made by the purchasing department.The manager randomly selected 12 payments,investigated them thoroughly,and determined the payment error for each of these payments.The payment error was defined as the difference between the amount paid and what should have been paid.The payment errors determined for these selected payments were as follows:
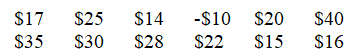 a.What is the 95% confidence interval for the population mean payment error?
b.Suppose a recent company report inferred that the mean payment error may be running as high as $25.That led the manager to test the null hypothesis that the population mean payment error is equal to $25 versus the alternative that the population mean payment error is not equal to $25.Using a significance level equal to 0.01, perform this hypothesis test.
c.Suppose another manager used this same data to test the null hypothesis that the population mean payment error is less than or equal to $15 versus the alternative that the population mean payment error is greater than to $15.What is the test statistic for this hypothesis testing situation?
a.What is the 95% confidence interval for the population mean payment error?
b.Suppose a recent company report inferred that the mean payment error may be running as high as $25.That led the manager to test the null hypothesis that the population mean payment error is equal to $25 versus the alternative that the population mean payment error is not equal to $25.Using a significance level equal to 0.01, perform this hypothesis test.
c.Suppose another manager used this same data to test the null hypothesis that the population mean payment error is less than or equal to $15 versus the alternative that the population mean payment error is greater than to $15.What is the test statistic for this hypothesis testing situation?
(Essay)
4.8/5 (36)
A _____ represents a theoretical model of the relative frequency of a random variable.
(Multiple Choice)
4.9/5 (37)
The Red Bead Experiment demonstrates that common-cause variation in processes cannot be predicted.
(True/False)
4.7/5 (39)
Correlation is a measure of the linear or non-linear relationship between two variables.
(True/False)
4.7/5 (38)
Which of the following is NOT an operational problem created by variation?
(Multiple Choice)
4.7/5 (44)
Exhibit 10-3
An engineer collected data from three different types of power drills.Specifically, the engineer collected data on how long (in minutes)each type of drill would run continuously after a full battery recharge.Each drill was charged and run continuously 15 times.The reported data are contained in the following table.The engineer analyzed the data using one-way ANOVA in Excel and the results from Excel are also given below.

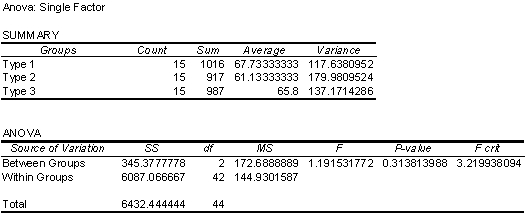 -Refer to Exhibit 10-3.What is the 95% confidence interval for the population mean continuous run time for the Type 3 drill?
(Multiple Choice)
4.9/5 (38)
Filters
- Essay(0)
- Multiple Choice(0)
- Short Answer(0)
- True False(0)
- Matching(0)