Exam 13: Inference About Comparing Two Populations
Exam 1: What Is Statistics43 Questions
Exam 2: Graphical Descriptive Techniques I93 Questions
Exam 3: Graphical Descriptive Techniques II183 Questions
Exam 4: Numerical Descriptive Techniques274 Questions
Exam 5: Data Collection and Sampling82 Questions
Exam 6: Probability234 Questions
Exam 7: Random Variables and Discrete Probability Distributions274 Questions
Exam 8: Continuous Probability Distributions215 Questions
Exam 9: Sampling Distributions153 Questions
Exam 10: Introduction to Estimation152 Questions
Exam 11: Introduction to Hypothesis Testing182 Questions
Exam 12: Inference About a Population147 Questions
Exam 13: Inference About Comparing Two Populations170 Questions
Exam 14: Analysis of Variance153 Questions
Exam 15: Chi-Squared Tests175 Questions
Exam 16: Simple Linear Regression and Correlation298 Questions
Exam 17: Multiple Regression157 Questions
Select questions type
Independent samples are those for which the selection process for one is not related to the selection process for the other.
(True/False)
4.8/5  (38)
(38)
The number of degrees of freedom associated with the t-test, when the data are gathered from a matched pairs experiment with 10 pairs, is:
(Multiple Choice)
4.8/5 (34)
When comparing two population variances, we use the ratio  rather than the difference
  .
.
(True/False)
4.8/5 (40)
Undergraduates' Test Scores
35 undergraduate students who completed two years of college were asked to take a basic mathematics test.The mean and standard deviation of their scores were 75.1 and 12.8, respectively.In a random sample of 50 students who only completed high school, the mean and standard deviation of the test scores were 72.1 and 14.6, respectively.
-{Undergraduates' Test Scores Narrative} Can we infer at the 10% significance level that a difference exists between the two groups?
(Essay)
4.9/5 (27)
All F-tests for the equality of two population variances are one-tailed tests.
(True/False)
4.8/5 (32)
Two measurements from the same individuals is an example of data collected from a(n) ____________________ experiment.
(Short Answer)
4.9/5 (32)
The difference in two sample proportions is a(n) ____________________ estimator of the difference in their respective population proportions.
(Short Answer)
4.8/5 (26)
The degrees of freedom for a test of the mean of the paired differences is the number of ____________________ minus ____________________.
(Short Answer)
4.8/5 (32)
The unequal-variances test statistic of  has an approximate ____________________ distribution with
 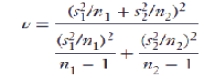 degrees of freedom.
(Short Answer)
4.9/5 (36)
In testing the difference between the means of two normally distributed populations, the number of degrees of freedom associated with the unequal-variances t-test statistic usually results in a non-integer number.It is recommended that you:
(Multiple Choice)
4.8/5 (35)
When testing the equality of two population variances the number in the null hypothesis is 0.
(True/False)
4.8/5 (34)
The expected value of the difference of two sample means equals the difference of the corresponding population means when:
(Multiple Choice)
4.8/5 (41)
Aptitude Test Scores
Two random samples of 40 students were drawn independently from two populations of students.Assume their aptitude tests are normally distributed (total points = 100).The following statistics regarding their scores in an aptitude test were obtained:  .
-{Aptitude Test Scores Narrative} Test at the 5% significance level to determine whether we can infer that the two population means differ.
.
-{Aptitude Test Scores Narrative} Test at the 5% significance level to determine whether we can infer that the two population means differ.
(Essay)
4.8/5 (33)
Two measurements from the same individuals is an example of data collected from a matched pairs experiment.
(True/False)
4.9/5 (38)
The F-test used for testing the difference in 2 population variances is always a one-tailed test.
(True/False)
4.8/5 (37)
We compare two population variances by examining their ____________________.
(Short Answer)
4.8/5 (37)
If there are 10 pairs of data in a matched pairs experiment, the degrees of freedom for the corresponding t-test is 18.
(True/False)
5.0/5 (33)
We use a t-test to determine whether two population variances are equal.
(True/False)
4.8/5 (37)
The pooled-variances t-test requires that the two population variances need not be the same.
(True/False)
4.9/5 (34)
The variance of the difference in sample proportions equals the difference of their population variances.
(True/False)
4.9/5 (26)
Filters
- Essay(0)
- Multiple Choice(0)
- Short Answer(0)
- True False(0)
- Matching(0)