Exam 3: Modeling and Solving Lp Problems in a Spreadsheet
Exam 1: Introduction to Modeling and Decision Analysis52 Questions
Exam 2: Introduction to Optimization and Linear Programming62 Questions
Exam 3: Modeling and Solving Lp Problems in a Spreadsheet88 Questions
Exam 4: Sensitivity Analysis and the Simplex Method72 Questions
Exam 5: Network Modeling72 Questions
Exam 6: Integer Linear Programming72 Questions
Exam 7: Goal Programming and Multiple Objective Optimization59 Questions
Exam 8: Nonlinear Programming and Evolutionary Optimization68 Questions
Exam 9: Regression Analysis76 Questions
Exam 10: Discriminant Analysis57 Questions
Exam 11: Time Series Forecasting111 Questions
Exam 12: Introduction to Simulation Using Risk Solver Platform65 Questions
Exam 13: Queuing Theory79 Questions
Exam 14: Decision Analysis102 Questions
Exam 15: Project Management Online61 Questions
Select questions type
Which tab in the Risk Solver Platform (RSP) task pane is used to define an optimization problem?
(Multiple Choice)
4.9/5  (37)
(37)
A hospital needs to determine how many nurses to hire to cover a 24 hour period. The nurses must work 8 consecutive hours but can start work at the start of 6 different shifts. They are paid different wages depending on when they start their shifts. The number of nurses required per 4-hour time period and their wages are shown in the following table.
Time period Required \# of Nurses Wage (\ /) 12-4 20 15 4-8 30 16 am 8-12 40 13 12-4 50 13 4-48 40 14 8-12 30 15
Enter the numbers in the appropriate cells of ranges B6:G11 and B13:G13 in the Excel spreadsheet to solve this problem based on the following formulation.
Let mumber of nurses warking in thme period
MiN: 1+1+1+1+1+1 Subject ta: 1+1\geq30 1+1\geq40 1+1\geq50 1+1\geq40 1+1\geq30 1+1\geq20 \geq0 
(Essay)
4.7/5 (31)
You have been given the following linear programming model and Excel spreadsheet to solve this problem. What cell references would you enter in the Risk Solver Platform (RSP) task pane for the following?
Objective Cell:
Variables Cells:
Constraints Cells:
MAX: 8+5 Subject to: 3+5=54 11+10\leq144 \geq12 \geq0 A B C D E 1 2 3 4 Number to make: OBJ. FN. VALUE 5 Unit profit: 8 5 6 7 Constraints: Used Available 8 1 3 5 54 9 2 11 10 144 10 3 1 0 12
(Essay)
4.9/5 (31)
A company is planning production for the next 4 quarters. They want to minimize the cost of production. The production cost, demand and production capacity vary from quarter to quarter. The maximum amount of inventory which can be held is 100 units and management wants to keep at least 50 units on hand. Quarterly inventory holding cost is 4% of the cost of production. There are currently 50 units in inventory. The company wants to produce at no less than one half of its maximum capacity in any quarter.
Quarter 1 2 3 4 Unit Production Cost \ 55 \ 50 \ 50 \ 45 Units Demanded 100 150 180 120 Maramum Praduction 150 150 160 130 Holding cost \ 2.2 \ 2 \ 2 \ 1.8 Let = number of units produced in quarter i,i=1,\ldots,4 = beginning inventory far quarter i
MIN: 55+50+50+45+ 2.2 + /2+2 + /2+2 + /2+1.8 + /2 Subject to: 75\leq\leq150 75\leq\leq150 80\leq\leq160 65\leq\leq130 50\leq+-100\leq100 50\leq+-150\leq100 50\leq+-180\leq100 50\leq+-120\leq100 =+-100 =+-150 =+-180 =+-120 \geq0  What formulas are required for cells D3, D6, D8, D15, D17 and D18 in the Excel spreadsheet implementation of the formulation?
(Essay)
4.9/5 (31)
Which type of spreadsheet cell represents the decision variables in an LP model?
(Multiple Choice)
4.8/5 (32)
The hospital administrators at New Hope, County General, and City East recently received notice of an impending state inspection of their facilities. Under new guidelines established to improve the overall health care system, state inspectors will be assessing the efficiency of each hospital. The staff at New Hope has suggested a mutual assistance program in preparation for the inspections and have proposed using DEA as a means to assess the efficiency of each facility. The data collected thus far is summarized in the following table. All data reflects averages compiled over the past six months.
New Hope Countv General City East Input Measures Bed days unused (1000s) 83.0 105.0 104.1 Supply expense (\ 1000) 123.8 162.3 154.0 Full-time staff 225.0 200.0 231.0 Output Measures Patient-days (1000s) 105.0 71.0 82.7 Nurses qualified 253.0 92.0 175.0 Assistants on staff 125.0 45.0 65.0 satiefartion 98.0 88.0 83.0
What are the key formulas for this Excel spreadsheet implementation of the following formulation?
Let werght as5igned to dutput
waight as5igned to ingut
MAX:
Subject ta:


(Essay)
4.7/5 (27)
Exhibit 3.1
The following questions are based on this problem and accompanying Excel windows.
Jones Furniture Company produces beds and desks for college students. The production process requires carpentry and varnishing. Each bed requires 6 hours of carpentry and 4 hour of varnishing. Each desk requires 4 hours of carpentry and 8 hours of varnishing. There are 36 hours of carpentry time and 40 hours of varnishing time available. Beds generate $30 of profit and desks generate $40 of profit. Demand for desks is limited, so at most 8 will be produced.
Let
= Number of Beds to produce = Number of Desks to produce The LP model for the problem is
MAX: 30+40 Subject to: 6+4\leq36 (carpentry) 4+8\leq40 (varnishing) \leq8 (demand for desks) ,\geq0 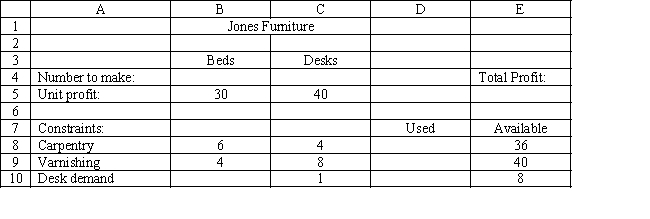 -Refer to Exhibit 3.1. Which of the following statements represent the carpentry, varnishing and limited demand for desks constraints?
(Multiple Choice)
4.8/5 (27)
A farmer is planning his spring planting. He has 20 acres on which he can plant a combination of Corn, Pumpkins and Beans. He wants to maximize his profit but there is a limited demand for each crop. Each crop also requires fertilizer and irrigation water which are in short supply. There are only 50 acre ft of irrigation available and only 8,000 pounds/acre of fertilizer available. The following table summarizes the data for the problem.
Crop Profit per Acre (\ ) Yield per Acre (Ib) Maximum Demand (Ib) Irrigation (acre ft) Fertilizer (pounds/acre) Corn 2,100 21,000 200,000 2 500 Pumpkin 900 10,000 180,000 3 400 Beans 1,050 3,500 80,000 1 300 Enter the numbers in the appropriate cells of ranges B12:D12 and E8:F12 in the Excel spreadsheet to solve this problem based on the following formulation.
Let
= aces of corn = acres of pumpkin = acres of beans
MAX:
Subject to:
A B C D E F 1 Farm Planning Problem 2 3 Corn Pumpkin Beans 4 Acres to plant Total Profit: 5 Profit per acre 6 7 Constraints: Used Available 8 Corn demand 9 Pumpkin demand 10 Bean demand 11 Water 12 Fertilizer
(Essay)
4.9/5 (35)
You have been given the following linear programming model and Excel spreadsheet to solve this problem. What cell references would you enter in the Risk Solver Platform (RSP) task pane for the following?
Objective Cell:
Variables Cells:
Constraints Cells:
MIN:
Subject to:
8+5\geq80 3+5\geq60 ,\geq0 A B C D E 1 2 3 4 Number to make: OBJ. FN. VALUE 5 Unit profit: 6 7 Constraints: Used Available 8 1 1 8 9 2 8 5 80 10 3 3 5 60
(Essay)
4.9/5 (36)
Carlton construction is supplying building materials for a new mall construction project in Kansas. Their contract calls for a total of 250,000 tons of material to be delivered over a three-week period. Carlton's supply depot has access to three modes of transportation: a trucking fleet, railway delivery, and air cargo transport. Their contract calls for 120,000 tons delivered by the end of week one, 80% of the total delivered by the end of week two, and the entire amount delivered by the end of week three. Contracts in place with the transportation companies call for at least 45% of the total delivered be delivered by trucking, at least 40% of the total delivered be delivered by railway, and up to 15% of the total delivered be delivered by air cargo. Unfortunately, competing demands limit the availability of each mode of transportation each of the three weeks to the following levels (all in thousands of tons):
Week Trucking Limts Ralway Limits Air Cargo Limits 1 45 60 15 2 50 55 10 3 55 45 5 Costs (\ per 1000 tons ) \ 200 \ 140 \ 400
Formulate an LP model for this logistics problem.
(Essay)
4.7/5 (29)
Robert Hope received a welcome surprise in this management science class; the instructor has decided to let each person define the percentage contribution to their grade for each of the graded instruments used in the class. These instruments were: homework, an individual project, a mid-term exam, and a final exam. Robert's grades on these instruments were 75, 94, 85, and 92, respectively. However, the instructor complicated Robert's task somewhat by adding the following stipulations:
-homewark can account far up to of the grade, but must be at least af the grade;
- the praject can account for up to of the grade, but must be at least af the grade;
- the mid-term and final must each accaunt far betwen and of the grade but cannot accaunt far mare than of the grade when the percentages are cambined; and
- the project and final exam grades may not collectively constitute more than of the Iratade. The following LP model allows Robert to maximize his numerical grade.
Let = weight assigned to hamewark = waight assigned to the praject = weight assigned to the midi-term = waight assigned to the final MAX: 75+94+85+92 Subject to: +++=1 +\leq0.70 +\geq0.50 0. 05\leq\leq0.25 0. 05\leq\leq0.25 0.10 \leq\leq0.40 0.10\leq\leq0.40  What values would you enter in the Risk Solver Platform (RSP) task pane for the cells in this Excel spreadsheet implementation of this problem?
Objective Cell:
Variables Cells:
Constraints Cells:
What values would you enter in the Risk Solver Platform (RSP) task pane for the cells in this Excel spreadsheet implementation of this problem?
Objective Cell:
Variables Cells:
Constraints Cells:
(Essay)
4.8/5 (36)
You have been given the following linear programming model and Excel spreadsheet to solve this problem. What cell references would you enter in the Risk Solver Platform (RSP) task pane for the following?
Objective Cell:
Variables Cells:
Constraints Cells:
MAX: 12+9 Subject to: 9+10.5\leq126 \geq5 \geq6 ,\geq0 A B C D E 1 2 3 4 Number to make: OBJ. FN. VALUE 5 Unit profit: 12 9 6 7 Constraints: Used Available 8 1 9 10.5 126 9 2 1 0 5 10 3 0 1 6
(Essay)
4.8/5 (32)
Project 3.1- The Diet Problem: Ordering Meals from McDonald's
Based on: Robert A. Bosch, "Big Mac Attack: The Diet Problem revisited, Eating at McDonald's," OR/MS Today, August 1993, pp 30-31.
Tina Simpson is a new fourth-grade teacher at Forest Ridge Elementary. The first teacher workshop for the upcoming school year is next Monday and by majority vote, McDonald's was selected as the food of choice. As the new person, Tina is tasked with developing the meal for the workshop. McDonald's has graciously offered to deliver whatever food Tina decides to order, along with a variety of condiments applicable to whatever is ordered. Rather than offer a menu choice, Tina has decided to simply order the same meal for each person in the workshop.
To get started, Tina took a trip to McDonald's and obtained their published information on the nutritional content of their food. That data is summarized in the table below.

 Tina wants the meal to be nutritionally complete. The National Research Council publishes their Recommended Daily Allowances. In this publication, they contend that a diet (in this case the meal) should provide at least 100 percent of the U.S. RDA of numerous nutrients. The specific amount of the RDA depends on such factors as age, weight and gender. In addition, the council recommends daily sodium and cholesterol intakes be kept to at most 2.4 grams of sodium and 300 milligrams of cholesterol. Further, at most 30 percent of the calories consumed should come from fat, and at most 10 percent from saturated fat. Each gram of fat contains 9 calories.
Based on the above information, Tina wants to design a least-cost meal that provides at least 100% of the U.S. RDA of vitamins A, C, B1, B2, niacin, calcium, and iron; supplies at least 55 grams of protein; contains at most 3 grams of sodium; and contains at most 30 percent of its calories from fat. Only those foods list in the table above are available for the meal.
Formulate the LP model for Tina's problem. Develop a spreadsheet model of the problem and use Excel Solver to determine the least-cost meal that meets all the stated requirements.
What is the recommended meal? Is this meal reasonable? If not, modify the model to obtain what you believe to be a reasonable meal that meets the stated requirements.
Tina wants the meal to be nutritionally complete. The National Research Council publishes their Recommended Daily Allowances. In this publication, they contend that a diet (in this case the meal) should provide at least 100 percent of the U.S. RDA of numerous nutrients. The specific amount of the RDA depends on such factors as age, weight and gender. In addition, the council recommends daily sodium and cholesterol intakes be kept to at most 2.4 grams of sodium and 300 milligrams of cholesterol. Further, at most 30 percent of the calories consumed should come from fat, and at most 10 percent from saturated fat. Each gram of fat contains 9 calories.
Based on the above information, Tina wants to design a least-cost meal that provides at least 100% of the U.S. RDA of vitamins A, C, B1, B2, niacin, calcium, and iron; supplies at least 55 grams of protein; contains at most 3 grams of sodium; and contains at most 30 percent of its calories from fat. Only those foods list in the table above are available for the meal.
Formulate the LP model for Tina's problem. Develop a spreadsheet model of the problem and use Excel Solver to determine the least-cost meal that meets all the stated requirements.
What is the recommended meal? Is this meal reasonable? If not, modify the model to obtain what you believe to be a reasonable meal that meets the stated requirements.
(Not Answered)
This question doesn't have any answer yet
Which of the following describes Data Envelopment Analysis (DEA).
(Multiple Choice)
4.9/5 (37)
A financial planner wants to design a portfolio of investments for a client. The client has $400,000 to invest and the planner has identified four investment options for the money. The following requirements have been placed on the planner. No more than 30% of the money in any one investment, at least one half should be invested in long-term bonds which mature in six or more years, and no more than 40% of the total money should be invested in B or C since they are riskier investments. The planner has developed the following LP model based on the data in this table and the requirements of the client. The objective is to maximize the total return of the portfolio.
Investment Return Years to Maturity Rating 6.45\% 6 1-Excellent B 8.5\% 5 3-Gaod C 9.00\% 8 4-Fair D 7.75\% 4 2-Very Gaod Let = Dollars invested in = Dollars invested in = Dollars invested in = Dollars invested in MAX: 45+.085+ . 990+.075 Subject to: +++\leq400000 \leq120000 \leq120000 \leq120000 \leq120000 +\geq200000 +\leq160000 \geq0 
 What formulas are required for the following cells in the Excel spreadsheet implementation of the formulation?
B7
D7
F7
H7
What formulas are required for the following cells in the Excel spreadsheet implementation of the formulation?
B7
D7
F7
H7
(Essay)
4.7/5 (25)
The "Objective Value of" option in the Risk Solver Platform (RSP) task pane may be used to
(Multiple Choice)
4.9/5 (32)
You have been given the following linear programming model and Excel spreadsheet to solve this problem. What numbers should be entered into cells B5:C5 and B8:C10 to implement this model?
MAX: 4+3 Subject to: 6+7\leq84 \leq10 \leq8 ,\geq0 A B C D E 1 2 3 4 Number to make: OBJ. FN. VALUE 5 Unit profit: 6 7 Constraints: Used Available 8 1 84 9 2 10 10 3 8
(Essay)
4.9/5 (44)
A financial planner wants to design a portfolio of investments for a client. The client has $400,000 to invest and the planner has identified four investment options for the money. The following requirements have been placed on the planner. No more than 30% of the money in any one investment, at least one half should be invested in long-term bonds which mature in six or more years, and no more than 40% of the total money should be invested in B or C since they are riskier investments. The planner has developed the following LP model based on the data in this table and the requirements of the client. The objective is to maximize the total return of the portfolio.
Investment Return Years to Maturity Rating 6.45\% 6 1-Excellent B 8.5\% 5 3-Gaod C 9.00\% 8 4-Fair D 7.75\% 4 2-Very Gaod Formulate the LP for this problem.
(Essay)
4.8/5 (37)
Filters
- Essay(0)
- Multiple Choice(0)
- Short Answer(0)
- True False(0)
- Matching(0)