Exam 15: Process Improvement Using Control Charts
Exam 1: An Introduction to Business Statistics63 Questions
Exam 2: Descriptive Statistics: Tabular and Graphical Methods100 Questions
Exam 3: Descriptive Statistics: Numerical Methods141 Questions
Exam 4: Probability127 Questions
Exam 5: Discrete Random Variables150 Questions
Exam 6: Continuous Random Variables145 Questions
Exam 7: Sampling and Sampling Distributions131 Questions
Exam 8: Confidence Intervals149 Questions
Exam 9: Hypothesis Testing150 Questions
Exam 10: Statistical Inferences Based on Two Samples139 Questions
Exam 11: Experimental Design and Analysis of Variance98 Questions
Exam 12: Chi-Square Tests112 Questions
Exam 13: Simple Linear Regression Analysis140 Questions
Exam 14: Multiple Regression and Model Building150 Questions
Exam 15: Process Improvement Using Control Charts117 Questions
Select questions type
A bank officer wishes to study how many customers write bad checks.To accomplish this,the officer randomly selects a weekly sample of 100 checking accounts and records the number that wrote bad checks.The numbers of customers who wrote bad checks in 20 consecutive weekly samples of 100 account holders are,respectively,1,4,9,0,4,6,0,3,8,5,3,5,2,9,4,4,3,6,4,and 0.On the basis of the limits established,if the bank finds that 12 customers in the next weekly sample of 100 account holders have written bad checks,should the bank believe that there has been an unusual variation in the process?
(Multiple Choice)
4.9/5  (41)
(41)
How well a process is able to meet the requirements set forth by the process design is called the quality of design.
(True/False)
4.8/5 (31)
The quality of an electronic component used in manufacturing cell phones is monitored with a p chart.In the last 20 days,daily samples of 75 units resulted in the following number of defective units per sample: 8,4,3,7,3,1,0,7,4,2,0,1,6,2,4,3,1,2,8,and 5.If on the 21st day,9 defective units were found in the sample of 75 units,would the process be in control?
(Multiple Choice)
4.8/5 (44)
A(n)____________ process has the ability to produce products or services that meet customer requirements.
(Multiple Choice)
4.8/5 (28)
A motorcycle manufacturer produces the parts for its vehicles in different locations and transports them to its plant for assembly.To keep the assembly operations running efficiently,it is vital that all parts be within specification limits.One important part used in the assembly is the engine camshaft,and one important quality characteristic is the case hardness depth.Specifications state that the hardness depth must be between 3.0 mm and 6.0 mm.To investigate the process,the quality control engineer selected 25 daily subgroups of n = 5 and measured the hardness depth.The process yielded a mean of the means  = 4.50 and an average range = 1.01.How many standard deviations of leeway exist between x and the specification closest to x?
(Multiple Choice)
4.7/5 (31)
For a manufacturing process,  = 10 inches,
  = .4 inches,and the subgroup sample size is 6 units.Calculate the standard control limits for the
  chart.
(Multiple Choice)
4.7/5 (27)
A sequence of steadily increasing plot points on a control chart is referred to as ___________.
(Multiple Choice)
4.8/5 (41)
A manufacturer of windows produces one type that has a plastic coating.The specification limits for the plastic coating are 30 and 70.From time to time the plastic coating can become uneven.Therefore,to keep the coating as even as possible,thickness measurements are periodically taken at four different locations on the window.15 subgroups were observed,each consisting of four thickness measurements,with the following results: mean of the means =  = 50.05,and average range of 8.85.Assuming that the process is in statistical control,calculate the natural tolerance limits for the process.
(Multiple Choice)
4.9/5 (37)
A manufacturer of windows produces one type that has a plastic coating.The specification limits for the plastic coating are 30 and 70.From time to time the plastic coating can become uneven.Therefore,in order to keep the coating as even as possible,thickness measurements are periodically taken at four different locations on the window.15 subgroups were observed,each consisting of four thickness measurements,with the following results: mean of the means =  = 50.05,and average range = 8.85.Calculate the center line for the R chart.
(Multiple Choice)
4.9/5 (29)
If a manufacturing process is in statistical control,it means that the process is capable of producing products that meet the needs of the customers.
(True/False)
4.9/5 (35)
The distance between natural tolerance limits and customer specifications is called ____________.
(Multiple Choice)
4.9/5 (28)
A manufacturer of windows produces one type that has a plastic coating.The specification limits for the plastic coating are 30 and 70.From time to time the plastic coating can become uneven.Therefore,in order to keep the coating as even as possible,thickness measurements are periodically taken at four different locations on the window.15 subgroups were observed,each consisting of four thickness measurements,with the following results: mean of the means =  = 50.05,and average range = 8.85.Calculate the control limits for the X-bar chart.
(Multiple Choice)
4.8/5 (37)
When a process is influenced only by common causes of variation:
(Multiple Choice)
4.8/5 (40)
A ___________ is a set of process observations that are examined for the purpose of constructing control charts.
(Multiple Choice)
4.8/5 (35)
___________ causes of variation may be remedied by local supervision.
(Multiple Choice)
4.9/5 (32)
A foreman wants to use an  chart to control the average length of the bolts manufactured.He has recently collected the six samples given below.
 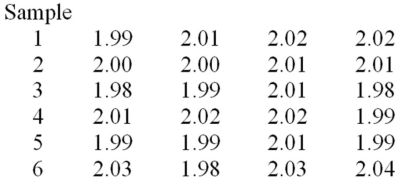 Determine the LCL and the UCL for the
  chart.
(Multiple Choice)
4.8/5 (42)
Among other quality measures,the quality of an electronic component used in manufacturing stereo speakers is monitored with a p chart.In the last 25 days,daily samples of 60 units resulted in the following number of defective units per sample: 8,4,3,7,6,2,5,3,1,0,7,4,2,0,1,6,2,4,3,1,2,8,5,6,0.Determine the center line for this process.
(Multiple Choice)
4.8/5 (31)
A control chart is a graph whose purpose is to detect assignable causes of variation in a process.
(True/False)
4.9/5 (25)
A bank officer wishes to study how many customers write bad checks.To accomplish this,the officer randomly selects a weekly sample of 100 checking accounts and records the number that wrote bad checks.The numbers of customers who wrote bad checks in 20 consecutive weekly samples of 100 account holders are,respectively,1,4,9,0,4,6,0,3,8,5,3,5,2,9,4,4,3,6,4,and 0.Find the appropriate center line.
(Multiple Choice)
4.7/5 (39)
A control chart on which subgroup means are plotted versus time is a(n)_________ chart.
(Multiple Choice)
4.8/5 (29)
Filters
- Essay(0)
- Multiple Choice(0)
- Short Answer(0)
- True False(0)
- Matching(0)