Exam 15: Process Improvement Using Control Charts
Exam 1: An Introduction to Business Statistics63 Questions
Exam 2: Descriptive Statistics: Tabular and Graphical Methods100 Questions
Exam 3: Descriptive Statistics: Numerical Methods141 Questions
Exam 4: Probability127 Questions
Exam 5: Discrete Random Variables150 Questions
Exam 6: Continuous Random Variables145 Questions
Exam 7: Sampling and Sampling Distributions131 Questions
Exam 8: Confidence Intervals149 Questions
Exam 9: Hypothesis Testing150 Questions
Exam 10: Statistical Inferences Based on Two Samples139 Questions
Exam 11: Experimental Design and Analysis of Variance98 Questions
Exam 12: Chi-Square Tests112 Questions
Exam 13: Simple Linear Regression Analysis140 Questions
Exam 14: Multiple Regression and Model Building150 Questions
Exam 15: Process Improvement Using Control Charts117 Questions
Select questions type
Auxiliary lines drawn on a control chart for accomplishing pattern analysis are called ___________ boundaries.
(Multiple Choice)
4.8/5  (35)
(35)
If ![If = 5.2, = .3,and n = 4,and if the specifications are [4.6,5.8],is the process capable?](https://storage.examlex.com/TB1736/11eb06d7_5566_8718_8177_a994db344d8f_TB1736_11.jpg) = 5.2,
= 5.2, ![If = 5.2, = .3,and n = 4,and if the specifications are [4.6,5.8],is the process capable?](https://storage.examlex.com/TB1736/11eb06d7_5566_8719_8177_01348d70c3b7_TB1736_11.jpg) = .3,and n = 4,and if the specifications are [4.6,5.8],is the process capable?
= .3,and n = 4,and if the specifications are [4.6,5.8],is the process capable?
(Multiple Choice)
4.8/5 (36)
In 20 samples,there are 80 units defective.If each sample consists of 100 units,find the appropriate UCL and the LCL for the p chart.
(Multiple Choice)
4.9/5 (25)
A control chart on which subgroup ranges are plotted versus time is a(n)_____ chart.
(Multiple Choice)
4.9/5 (39)
In a manufacturing process,if the limits for a control chart are set too _____________,the risk of not investigating a special cause of variation and possibly not taking a corrective action ____________.
(Multiple Choice)
4.7/5 (26)
If 20 samples of size 7 are drawn,with  = 33.33 and
  = 5.65,what is the A-B upper boundary for the
  chart?
(Multiple Choice)
4.9/5 (38)
A powder metal manufacturing company is producing sleeves for a locking mechanism.The target (nominal)value for the inside diameter is 1 inch.The inside diameter specifications are 1 ± .005 inches.Assume that the process is in statistical control with  = 1.0002 inches,
  = .003 inches,and subgroup size of 5.Calculate the estimated proportion of out-of-specification sleeve inside diameters.
(Multiple Choice)
4.7/5 (32)
A motorcycle manufacturer produces the parts for its vehicles in different locations and transports them to its plant for assembly.In order to keep the assembly operations running efficiently,it is vital that all parts be within specification limits.One important part used in the assembly is the engine camshaft,and one important quality characteristic is the case hardness depth.Specifications state that the hardness depth must be between 3.0 mm and 6.0 mm.To investigate the process,the quality control engineer selected 25 daily subgroups of n = 5 and measured the hardness depth.The process yielded a mean of the means  = 4.50 and an average range = 1.01.Calculate the center line for the R chart.
(Multiple Choice)
4.7/5 (37)
Assume that 25 samples of 50 each are taken and the total number of defectives is 34.Calculate 
(Multiple Choice)
4.8/5 (40)
A foreman wants to use an  chart to control the average length of the bolts manufactured.He has recently collected the six samples given below.
 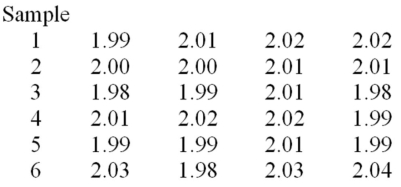 Calculate the average range.
(Multiple Choice)
4.9/5 (31)
If 20 samples of size 7 are drawn,with  = 33.33 and
  = 5.65,what are the LCL and the UCL for the
  chart?
(Multiple Choice)
4.9/5 (35)
If  and R charts are used to control a manufacturing process,an ______ chart is analyzed first and brought into a state of statistical control before preparing the _______ chart.
(Multiple Choice)
4.9/5 (25)
A manufacturer of windows produces one type that has a plastic coating.The specification limits for the plastic coating are 30 and 70.From time to time the plastic coating can become uneven.Therefore,to keep the coating as even as possible,thickness measurements are periodically taken at four different locations on the window.15 subgroups were observed,each consisting of four thickness measurements,with the following results: mean of the means =  = 50.05,and average range of 8.85.Find the sigma level capability of the process.
(Multiple Choice)
4.9/5 (34)
Unusual sources of process variation that can be attributed to specific reasons are called ____________ causes of variation.
(Multiple Choice)
4.7/5 (34)
Reducing common causes of variation usually requires action by management.
(True/False)
4.8/5 (33)
A powder metal manufacturing company is producing sleeves for a locking mechanism.The target (nominal)value for the inside diameter is 1 inch.The inside diameter specifications are 1 ± .005 inches.Assume that the process is in statistical control with  = 1.0002 inches,
  = .003 inches,and subgroup size of 5.What are the natural tolerance limits for this process? Is the process capable?
(Multiple Choice)
4.8/5 (34)
If a company is using an  chart for a given process with measurement data,it is generally not important or necessary to use an R chart or s chart.
(True/False)
4.8/5 (36)
Periodic sampling is observing the output of a process at random intervals.
(True/False)
4.8/5 (39)
Process leeway is the distance between natural tolerance limits and control limits.
(True/False)
4.9/5 (38)
If a control chart is used correctly and the necessary corrective actions are taken,then as the control limits get close to each other,the potential quality of the product _____________.
(Multiple Choice)
4.8/5 (32)
Filters
- Essay(0)
- Multiple Choice(0)
- Short Answer(0)
- True False(0)
- Matching(0)