Exam 15: Process Improvement Using Control Charts
Exam 1: An Introduction to Business Statistics63 Questions
Exam 2: Descriptive Statistics: Tabular and Graphical Methods100 Questions
Exam 3: Descriptive Statistics: Numerical Methods141 Questions
Exam 4: Probability127 Questions
Exam 5: Discrete Random Variables150 Questions
Exam 6: Continuous Random Variables145 Questions
Exam 7: Sampling and Sampling Distributions131 Questions
Exam 8: Confidence Intervals149 Questions
Exam 9: Hypothesis Testing150 Questions
Exam 10: Statistical Inferences Based on Two Samples139 Questions
Exam 11: Experimental Design and Analysis of Variance98 Questions
Exam 12: Chi-Square Tests112 Questions
Exam 13: Simple Linear Regression Analysis140 Questions
Exam 14: Multiple Regression and Model Building150 Questions
Exam 15: Process Improvement Using Control Charts117 Questions
Select questions type
The number of estimated process standard deviations between  and the closest specification limit is the _____________ of the process.
(Multiple Choice)
5.0/5  (35)
(35)
When employing measurement data to study a process,the __________ monitors the process variation.
(Multiple Choice)
4.7/5 (36)
If  = 2.0144,
  = .0972,and there are 25 subgroups of size 5,find the UCL and the LCL for the
  chart.
(Multiple Choice)
4.8/5 (48)
A motorcycle manufacturer produces the parts for its vehicles in different locations and transports them to its plant for assembly.In order to keep the assembly operations running efficiently,it is vital that all parts be within specification limits.One important part used in the assembly is the engine camshaft,and one important quality characteristic is the case hardness depth.Specifications state that the hardness depth must be between 3.0 mm and 6.0 mm.To investigate the process,the quality control engineer selected 25 daily subgroups of n = 5 and measured the hardness depth.The process yielded a mean of the means  = 4.50 and an average range = 1.01.Find the sigma level capability of the process.
(Multiple Choice)
4.8/5 (34)
If  = 5.2,
  = .3,and n = 4,calculate the natural tolerance limits.
(Multiple Choice)
5.0/5 (32)
If the ________ limits are within the ________ limits,then it can be concluded that the process is __________.
(Multiple Choice)
4.8/5 (40)
A foreman wants to use an  chart to control the average length of the bolts manufactured.He has recently collected the six samples given below.
 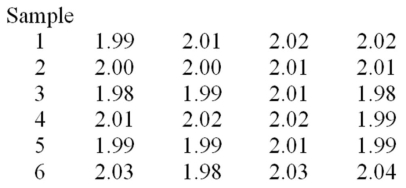 Determine the LCL and the UCL for the R chart.
(Multiple Choice)
4.8/5 (35)
Sources of process variations that are inherent to the process design are called ___________ causes of variation.
(Multiple Choice)
4.7/5 (33)
The quality of an electronic component used in manufacturing cell phones is monitored with a p chart.In the last 20 days,daily samples of 75 units resulted in the following number of defective units per sample: 8,4,3,7,3,1,0,7,4,2,0,1,6,2,4,3,1,2,8,and 5.Find the LCL and UCL for the p chart.
(Multiple Choice)
4.8/5 (27)
A fastener company produces a certain type of bolt for the automobile industry with a nominal (target)length of 2.00 inches.The specifications for the length of the bolt are 2.00 ± .006 inches.An automobile manufacturer will only purchase from this company if the sigma level of capability of the process is at least 4.If the process mean is equal to 2.001,determine the maximum process standard deviation necessary for the fastener manufacturing company in order to qualify as a supplier for the automobile manufacturing company.
(Multiple Choice)
4.8/5 (34)
A sequence of steadily decreasing points on a control chart is called run down.
(True/False)
4.7/5 (34)
If the process variability steadily increases,we would observe:
(Multiple Choice)
4.8/5 (33)
A cause-and-effect diagram enumerates the potential causes of an undesirable effect on the process to discover sources of process variation and to identify opportunities for process improvement.
(True/False)
4.8/5 (39)
A powder metal manufacturing company is producing sleeves for a locking mechanism.The target (nominal)value for the inside diameter is 1 inch.The inside diameter specifications are 1 ± .005 inches.Assume that the process is in statistical control with  = 1.0002 inches,
  = .003 inches,and subgroup size of 5.Calculate the control limits for the
  chart.
(Multiple Choice)
4.8/5 (36)
Suppose that a tire manufacturer uses  and R charts based on subgroups of size 4 to monitor tire diameter.The
  andR charts are found to be in statistical control,with
 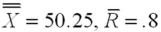 inches.A histogram of the tire diameter measurements indicates that these measurements are approximately normally distributed.Find the sigma level capability of the process.
(Multiple Choice)
5.0/5 (38)
Unusual sources of variation that can be attributed to specific causes are called the common causes of process variation.
(True/False)
4.8/5 (42)
How well the design of the product meets and exceeds the needs and expectations of the customers is called the quality of performance.
(True/False)
4.8/5 (31)
Sigma level capability is the number of estimated process standard deviations between the estimated process mean and the specification limit closest to the estimated process mean.
(True/False)
4.8/5 (29)
A manufacturer of windows produces one type that has a plastic coating.The specification limits for the plastic coating are 30 and 70.From time to time the plastic coating can become uneven.Therefore,in order to keep the coating as even as possible,thickness measurements are periodically taken at four different locations on the window.15 subgroups were observed,each consisting of four thickness measurements,with the following results: mean of the means =  = 50.05,and average range of 8.85.Calculate the control limits for the R chart.
(Multiple Choice)
4.9/5 (26)
Filters
- Essay(0)
- Multiple Choice(0)
- Short Answer(0)
- True False(0)
- Matching(0)