Exam 13: Simple Linear Regression Analysis
Exam 1: An Introduction to Business Statistics63 Questions
Exam 2: Descriptive Statistics: Tabular and Graphical Methods100 Questions
Exam 3: Descriptive Statistics: Numerical Methods141 Questions
Exam 4: Probability127 Questions
Exam 5: Discrete Random Variables150 Questions
Exam 6: Continuous Random Variables145 Questions
Exam 7: Sampling and Sampling Distributions131 Questions
Exam 8: Confidence Intervals149 Questions
Exam 9: Hypothesis Testing150 Questions
Exam 10: Statistical Inferences Based on Two Samples139 Questions
Exam 11: Experimental Design and Analysis of Variance98 Questions
Exam 12: Chi-Square Tests112 Questions
Exam 13: Simple Linear Regression Analysis140 Questions
Exam 14: Multiple Regression and Model Building150 Questions
Exam 15: Process Improvement Using Control Charts117 Questions
Select questions type
The slope of the simple linear regression equation represents the average change in the value of the dependent variable per unit change in the independent variable (X).
(True/False)
4.9/5  (41)
(41)
In simple linear regression analysis,we assume that the variance of the independent variable (X)is equal to the variance of the dependent variable (Y).
(True/False)
5.0/5 (40)
A data set with 7 observations yielded the following.Use the simple linear regression model.  SSE = 1.117
Find the rejection point for the t statistic (α = .05).Test H0: β1 ≤ 0 vs.Ha: β1> 0.
SSE = 1.117
Find the rejection point for the t statistic (α = .05).Test H0: β1 ≤ 0 vs.Ha: β1> 0.
(Short Answer)
4.8/5 (34)
If one of the assumptions of the regression model is violated,performing data transformations on the ____________ can remedy the situation.
(Multiple Choice)
4.9/5 (39)
An experiment was performed on a certain metal to determine if the strength is a function of heating time.Results based on 10 metal sheets are given below.Use the simple linear regression model. 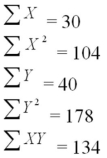 Calculate the correlation coefficient.
(Short Answer)
4.7/5 (27)
Use the following results obtained from a simple linear regression analysis with 12 observations. 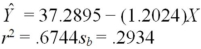 Test to determine if there is a significant negative relationship between the independent and dependent variables at α = .05.Give the test statistic and the resulting conclusion.
(Short Answer)
4.8/5 (41)
Consider the following partial computer output from a simple linear regression analysis.  Analysis of Variance
  What is the estimated y-intercept?
(Short Answer)
4.8/5 (45)
A data set with 7 observations yielded the following.Use the simple linear regression model. 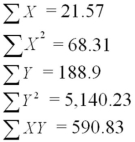 SSE = 1.117
Calculate the standard error.
SSE = 1.117
Calculate the standard error.
(Short Answer)
4.7/5 (33)
Consider the following partial computer output from a simple linear regression analysis.  Analysis of Variance
  What is the predicted value of y when x = 9.00?
(Short Answer)
4.9/5 (24)
The experimental region is the range of the previously observed values of the dependent variable.
(True/False)
4.7/5 (29)
After plotting the data points on a scatter diagram,we have observed an inverse relationship between the independent variable (X)and the dependent variable (Y).Therefore,we can expect both the sample ___________ and the sample _____________ to be negative values.
(Multiple Choice)
4.8/5 (34)
Consider the following partial computer output from a simple linear regression analysis. 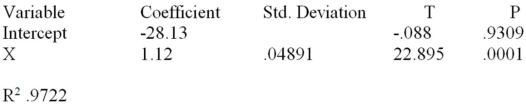 Test H0: β1 ≤ 0 vs.Ha: β1> 0.
(Short Answer)
4.8/5 (37)
Consider the following partial computer output from a simple linear regression analysis. 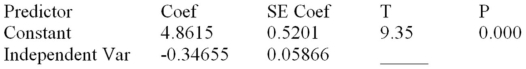 S = 0.4862 R-Sq = 0.7286
Analysis of Variance
S = 0.4862 R-Sq = 0.7286
Analysis of Variance 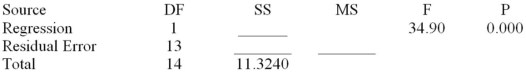 What is the correlation coefficient?
(Short Answer)
4.8/5 (47)
Consider the following partial computer output from a simple linear regression analysis.  Analysis of Variance
 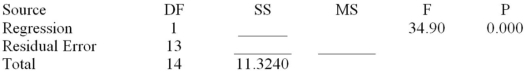 What is the coefficient of determination?
(Short Answer)
4.9/5 (32)
An experiment was performed on a certain metal to determine if the strength is a function of heating time.Partial results based on a sample of 10 metal sheets are given below.The simple linear regression equation is  The time is in minutes,the strength is measured in pounds per square inch,MSE = 0.5,
 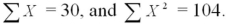 Determine the 95 percent prediction interval for the strength of a metal sheet when the average heating time is 4 minutes.The distance value has been found to be equal to 0.17143.
(Short Answer)
4.9/5 (39)
The least squares simple linear regression line minimizes the sum of the vertical deviations between the line and the data points.
(True/False)
4.7/5 (30)
The residual is the difference between the observed value of the dependent variable and the predicted value of the dependent variable.
(True/False)
4.9/5 (35)
Consider the following partial computer output from a simple linear regression analysis. 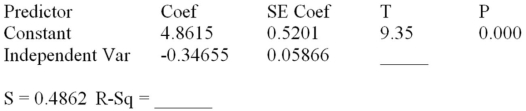 Analysis of Variance
  Calculate the SSE.
(Short Answer)
4.8/5 (35)
A local tire dealer wants to predict the number of tires sold each month.He believes that the number of tires sold is a linear function of the amount of money invested in advertising.He randomly selects 6 months of data consisting of tire sales (in thousands of tires)and advertising expenditures (in thousands of dollars).Based on the data set with 6 observations,the simple linear regression model yielded the following results. 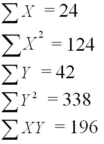 Calculate the coefficient of determination.
(Short Answer)
4.8/5 (32)
When using simple linear regression,we would like to use confidence intervals for the ___________ and prediction intervals for the ___________ at a given value of x.
(Multiple Choice)
4.8/5 (30)
Filters
- Essay(0)
- Multiple Choice(0)
- Short Answer(0)
- True False(0)
- Matching(0)