Exam 13: Simple Linear Regression Analysis
Exam 1: An Introduction to Business Statistics63 Questions
Exam 2: Descriptive Statistics: Tabular and Graphical Methods100 Questions
Exam 3: Descriptive Statistics: Numerical Methods141 Questions
Exam 4: Probability127 Questions
Exam 5: Discrete Random Variables150 Questions
Exam 6: Continuous Random Variables145 Questions
Exam 7: Sampling and Sampling Distributions131 Questions
Exam 8: Confidence Intervals149 Questions
Exam 9: Hypothesis Testing150 Questions
Exam 10: Statistical Inferences Based on Two Samples139 Questions
Exam 11: Experimental Design and Analysis of Variance98 Questions
Exam 12: Chi-Square Tests112 Questions
Exam 13: Simple Linear Regression Analysis140 Questions
Exam 14: Multiple Regression and Model Building150 Questions
Exam 15: Process Improvement Using Control Charts117 Questions
Select questions type
Consider the following partial computer output from a simple linear regression analysis. 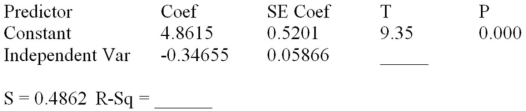 Analysis of Variance
 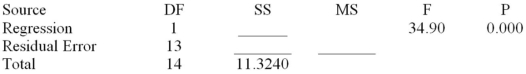 Calculate the MSE.
(Short Answer)
4.8/5  (36)
(36)
A local tire dealer wants to predict the number of tires sold each month.He believes that the number of tires sold is a linear function of the amount of money invested in advertising.He randomly selects 6 months of data consisting of tire sales (in thousands of tires)and advertising expenditures (in thousands of dollars).Based on the data set with 6 observations,the simple linear regression model yielded the following results. 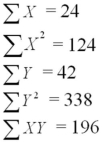 Determine the values of SSE and SST.
(Short Answer)
4.7/5 (23)
In a simple linear regression model,the coefficient of determination not only indicates the strength of the relationship between the independent and dependent variables,but also shows whether the relationship is positive or negative.
(True/False)
4.9/5 (28)
Consider the following partial computer output from a simple linear regression analysis. 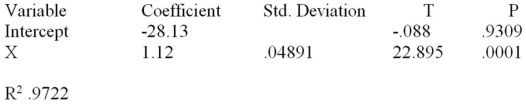 Calculate the correlation coefficient.
(Short Answer)
4.9/5 (28)
Consider the following partial computer output from a simple linear regression analysis.  Analysis of Variance
 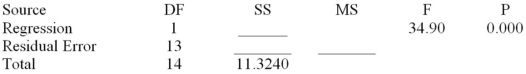 What is the explained variance?
(Short Answer)
4.9/5 (42)
A data set with 7 observations yielded the following.Use the simple linear regression model. 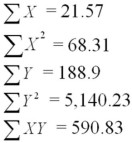 SSE = 1.117
Find the estimated slope.
SSE = 1.117
Find the estimated slope.
(Short Answer)
4.9/5 (33)
An experiment was performed on a certain metal to determine if the strength is a function of heating time.The sample size consists of 10 metal sheets.The simple linear regression equation is  The time is in minutes and the strength is measured in pounds per square inch.One of the 10 metal sheets was heated for 4 minutes and the resulting strength was 6 lbs.per square inch.Calculate the value of the residual for this observation.
(Short Answer)
4.8/5 (40)
The following results were obtained from a simple regression analysis:
Ŷ = 37.2895 - (1.2024)X
r2 = .6744sb = .2934
What is the proportion of the variation explained by the simple linear regression model?
(Short Answer)
4.7/5 (30)
When there is positive autocorrelation,over time,negative error terms are followed by positive error terms and positive error terms are followed by negative error terms.
(True/False)
4.8/5 (33)
A local tire dealer wants to predict the number of tires sold each month.He believes that the number of tires sold is a linear function of the amount of money invested in advertising.He randomly selects 6 months of data consisting of tire sales (in thousands of tires)and advertising expenditures (in thousands of dollars).Based on the data set with 6 observations,the simple linear regression model yielded the following results. 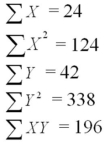 Determine the value of the estimated y-intercept.
(Short Answer)
4.9/5 (25)
In simple regression analysis,r2 is a percentage measure and measures the proportion of the variation explained by the simple linear regression model.
(True/False)
4.7/5 (28)
An experiment was performed on a certain metal to determine if the strength is a function of heating time.The 95 percent confidence interval for the average strength of a metal sheet when the average heating time is 4 minutes is from 4.325 to 5.675.Therefore,we are confident at α = .05 that the average strength of this metal heated for four minutes is between 4.325 and 5.675 pounds per square inch.Do you agree or disagree with this statement?
(Short Answer)
4.7/5 (37)
What value of the Durbin-Watson statistic indicates that there is no autocorrelation present in time-ordered data?
(Multiple Choice)
4.8/5 (29)
A local tire dealer wants to predict the number of tires sold each month.He believes that the number of tires sold is a linear function of the amount of money invested in advertising.He randomly selects 6 months of data consisting of tire sales (in thousands of tires)and advertising expenditures (in thousands of dollars).Based on the data set with 6 observations,the simple linear regression equation of the least squares line is ŷ = 3 + 1x. 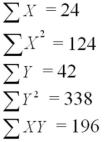 MSE = 4
Using the sums of the squares given above,determine the 90 percent confidence interval for the mean value of monthly tire sales when the advertising expenditure is $5000.
MSE = 4
Using the sums of the squares given above,determine the 90 percent confidence interval for the mean value of monthly tire sales when the advertising expenditure is $5000.
(Short Answer)
4.9/5 (32)
The _____________ measures the strength of the linear relationship between the dependent variable and the independent variable.
(Multiple Choice)
4.9/5 (33)
Consider the following partial computer output from a simple linear regression analysis. 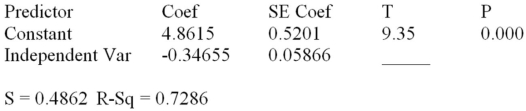 Analysis of Variance
  Test to determine if there is a significant correlation between x and y.Use H0: ρ = 0 versus Ha: ρ ≠ 0 with α = .01.Show the test statistic used in the decision.
(Essay)
4.7/5 (27)
The following results were obtained as part of a simple regression analysis: 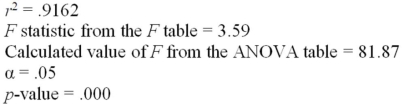 The null hypothesis of no linear relationship between the dependent variable and the independent variable:
(Multiple Choice)
4.8/5 (35)
A data set with 7 observations yielded the following.Use the simple linear regression model. 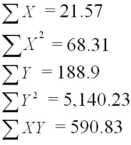 SSE = 1.117
Find the estimated y-intercept.
SSE = 1.117
Find the estimated y-intercept.
(Short Answer)
4.8/5 (32)
A local tire dealer wants to predict the number of tires sold each month.He believes that the number of tires sold is a linear function of the amount of money invested in advertising.He randomly selects 6 months of data consisting of tire sales (in thousands of tires)and advertising expenditures (in thousands of dollars).Based on the data set with 6 observations,the simple linear regression model yielded the following results. 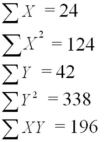 Find the rejection point for the t statistic at α = .05 and test H0: β1 = 0 vs.Ha: β1 ≠ 0.
(Short Answer)
4.8/5 (33)
Based on 25 time-ordered observations from a simple regression model,we have determined the Durbin-Watson statistic,d = 1.39.At α = .05,test to determine if there is any evidence of positive autocorrelation.State your conclusions.
(Essay)
4.7/5 (39)
Filters
- Essay(0)
- Multiple Choice(0)
- Short Answer(0)
- True False(0)
- Matching(0)