Exam 2: Descriptive Statistics: Tabular and Graphical Methods
Exam 1: An Introduction to Business Statistics63 Questions
Exam 2: Descriptive Statistics: Tabular and Graphical Methods100 Questions
Exam 3: Descriptive Statistics: Numerical Methods141 Questions
Exam 4: Probability127 Questions
Exam 5: Discrete Random Variables150 Questions
Exam 6: Continuous Random Variables145 Questions
Exam 7: Sampling and Sampling Distributions131 Questions
Exam 8: Confidence Intervals149 Questions
Exam 9: Hypothesis Testing150 Questions
Exam 10: Statistical Inferences Based on Two Samples139 Questions
Exam 11: Experimental Design and Analysis of Variance98 Questions
Exam 12: Chi-Square Tests112 Questions
Exam 13: Simple Linear Regression Analysis140 Questions
Exam 14: Multiple Regression and Model Building150 Questions
Exam 15: Process Improvement Using Control Charts117 Questions
Select questions type
Stem-and-leaf displays and dot plots are useful for detecting outliers.
(True/False)
4.7/5  (29)
(29)
Beginning the vertical scale of a graph at a value different from zero can cause increases to look more dramatic.
(True/False)
4.8/5 (46)
A CFO is looking at how much the company is spending on computing.He samples companies in the pharmaceutical industry and develops the following stem-and-leaf graph. 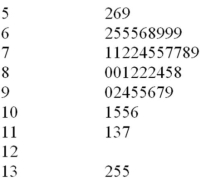 What is the approximate shape of the distribution of the data?
(Multiple Choice)
4.8/5 (38)
The number of weekly sales calls by a sample of 25 pharmaceutical salespersons is below. 24,56,43,35,37,27,29,44,34,28,33,28,46,31,38,41,48,38,27,29,37,33,31,40,50
How many classes should be used in the construction of a histogram?
(Multiple Choice)
4.9/5 (32)
The following data consist of the number of sick days taken by the 100 employees at a small manufacturing company for the past 18 months.Construct a dot plot of these data and describe the distribution.
5,1,4,8,0,6,3,5,3,4,7,15,5,8,2,1,5,4
(Essay)
4.9/5 (43)
An observation separated from the rest of the data is a(n)___________.
(Multiple Choice)
4.9/5 (34)
Recently an advertising company called 200 people and asked them to identify the company that was in an ad running nationwide.They obtained the following results. 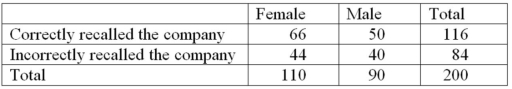 Construct a table of row percentages.
(Essay)
4.8/5 (35)
When grouping a large sample of measurements into classes,the ______________ is a better tool than the ___________.
(Multiple Choice)
4.8/5 (25)
When we wish to summarize the proportion (or fraction)of items in a class,we use the frequency distribution for each class.
(True/False)
4.8/5 (33)
It is possible to create different interpretations of the same graphical display by simply using different captions.
(True/False)
4.8/5 (32)
The number of items rejected daily by a manufacturer because of defects for the last 30 days are:
20,21,8,17,22,19,18,19,14,17,11,6,21,25,4,19,9,12,16,16,10,28,24,6,21,20,25,5,17,8
Complete this frequency table for these data 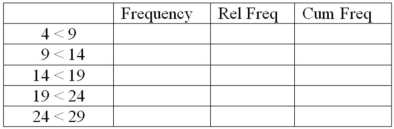
(Essay)
5.0/5 (38)
A CFO is looking at how much the company is spending on computing.He samples companies in the pharmaceutical industry and develops the following stem-and-leaf graph.  What would be the first class interval for the frequency histogram?
(Multiple Choice)
4.9/5 (35)
Leaves on a stem-and-leaf display should be rearranged so that they are in increasing order from left to right.
(True/False)
4.8/5 (38)
At the end of their final exam,550 students answered an additional question in which they rated the teaching effectiveness of their instructor,with the following results. 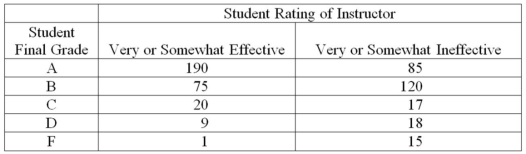 What proportion of the students who rated their instructor as very or somewhat effective received a B or better in the class?
(Multiple Choice)
4.9/5 (33)
The stem-and-leaf display is advantageous because it allows us to actually see the measurements in the data set.
(True/False)
4.8/5 (34)
When establishing the classes for a frequency table,it is generally agreed that the more classes you use,the better your frequency table will be.
(True/False)
4.7/5 (38)
Consider the following data. 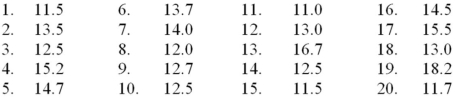 Create a stem-and-leaf display for the sample.
(Essay)
4.9/5 (35)
When looking at the shape of the distribution using a stem-and-leaf,a distribution is skewed to the right when the left tail is shorter than the right tail.
(True/False)
4.8/5 (35)
Filters
- Essay(0)
- Multiple Choice(0)
- Short Answer(0)
- True False(0)
- Matching(0)