Exam 2: Descriptive Statistics: Tabular and Graphical Methods
Exam 1: An Introduction to Business Statistics63 Questions
Exam 2: Descriptive Statistics: Tabular and Graphical Methods100 Questions
Exam 3: Descriptive Statistics: Numerical Methods141 Questions
Exam 4: Probability127 Questions
Exam 5: Discrete Random Variables150 Questions
Exam 6: Continuous Random Variables145 Questions
Exam 7: Sampling and Sampling Distributions131 Questions
Exam 8: Confidence Intervals149 Questions
Exam 9: Hypothesis Testing150 Questions
Exam 10: Statistical Inferences Based on Two Samples139 Questions
Exam 11: Experimental Design and Analysis of Variance98 Questions
Exam 12: Chi-Square Tests112 Questions
Exam 13: Simple Linear Regression Analysis140 Questions
Exam 14: Multiple Regression and Model Building150 Questions
Exam 15: Process Improvement Using Control Charts117 Questions
Select questions type
A local electronics retailer recently conducted a study on purchasers of large screen televisions.The study recorded the type of television and the credit account balance of the customer at the time of purchase.They obtained the following results. 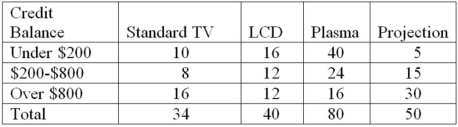 Construct a table of row percentages.
(Essay)
4.9/5  (29)
(29)
The percentage of measurements in a class is called the ___________ of that class.
(Multiple Choice)
4.7/5 (33)
A relative frequency curve having a long tail to the right is said to be ___________.
(Multiple Choice)
4.8/5 (31)
Using the following data,what would be the leaf unit in a stem-and-leaf display? 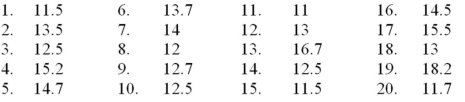
(Multiple Choice)
4.8/5 (35)
The number of items rejected daily by a manufacturer because of defects for the last 30 days are: 20,21,8,17,22,19,18,19,14,17,11,6,21,25,4,19,9,12,16,16,10,28,24,6,21,20,25,5,17,8
How many classes should be used in constructing a histogram?
(Multiple Choice)
4.9/5 (29)
Math test anxiety can be found throughout the general population.A study of 116 seniors at a local high school was conducted.The following table was produced from the data.Complete the missing parts. 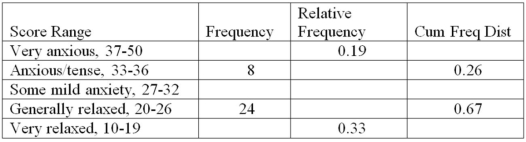
(Essay)
4.7/5 (44)
The following is a relative frequency distribution of grades in an introductory statistics course. 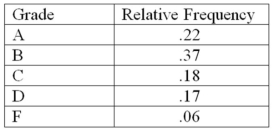 If this was the distribution of 200 students,give the frequency distribution for this data.
(Essay)
4.8/5 (35)
The number of weekly sales calls by a sample of 25 pharmaceutical salespersons is below.
24,56,43,35,37,27,29,44,34,28,33,28,46,31,38,41,48,38,27,29,37,33,31,40,50
Construct an ogive plot.
(Essay)
4.8/5 (31)
A local electronics retailer recently conducted a study on purchasers of large screen televisions.The study recorded the type of television and the credit account balance of the customer at the time of purchase.They obtained the following results. 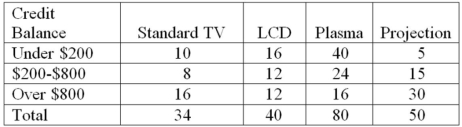 What percentage of purchases were plasma televisions by customers with the smallest credit balances?
(Multiple Choice)
4.8/5 (35)
The general term for a graphical display of categorical data made up of vertical or horizontal bars is called a(n)___________.
(Multiple Choice)
4.9/5 (36)
Recently an advertising company called 200 people and asked them to identify the company that was in an ad running nationwide.The following results were obtained. 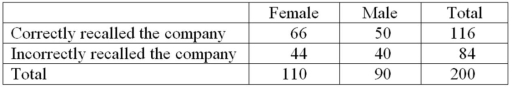 What percentage of those surveyed could not correctly recall the company?
(Multiple Choice)
4.8/5 (24)
The number of items rejected daily by a manufacturer because of defects for the last 30 days are:
20,21,8,17,22,19,18,19,14,17,11,6,21,25,4,19,9,12,16,16,10,28,24,6,21,20,25,5,17,8
Construct an ogive plot.
(Essay)
4.9/5 (40)
A stem-and-leaf display is a graphical portrayal of a data set that shows the overall pattern of variation in the data set.
(True/False)
4.8/5 (46)
Which one of the following graphical tools is used with quantitative data?
(Multiple Choice)
4.8/5 (31)
Recently an advertising company called 200 people and asked them to identify the company that was in an ad running nationwide.They obtained the following results. 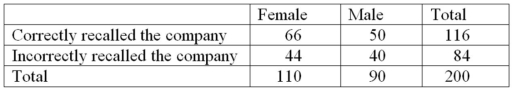 Construct a table of column percentages.
(Essay)
4.9/5 (28)
The number of weekly sales calls by a sample of 25 pharmaceutical salespersons is below. 24,56,43,35,37,27,29,44,34,28,33,28,46,31,38,41,48,38,27,29,37,33,31,40,50
What is the shape of the distribution of the data?
(Multiple Choice)
4.8/5 (31)
A histogram that tails out toward larger values is ___________.
(Multiple Choice)
4.8/5 (37)
Using the following data,describe the shape of the data distribution. 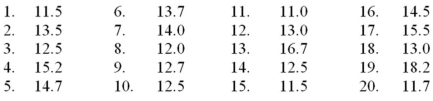
(Multiple Choice)
4.8/5 (32)
Filters
- Essay(0)
- Multiple Choice(0)
- Short Answer(0)
- True False(0)
- Matching(0)