Exam 2: Descriptive Statistics: Tabular and Graphical Methods
Exam 1: An Introduction to Business Statistics63 Questions
Exam 2: Descriptive Statistics: Tabular and Graphical Methods100 Questions
Exam 3: Descriptive Statistics: Numerical Methods141 Questions
Exam 4: Probability127 Questions
Exam 5: Discrete Random Variables150 Questions
Exam 6: Continuous Random Variables145 Questions
Exam 7: Sampling and Sampling Distributions131 Questions
Exam 8: Confidence Intervals149 Questions
Exam 9: Hypothesis Testing150 Questions
Exam 10: Statistical Inferences Based on Two Samples139 Questions
Exam 11: Experimental Design and Analysis of Variance98 Questions
Exam 12: Chi-Square Tests112 Questions
Exam 13: Simple Linear Regression Analysis140 Questions
Exam 14: Multiple Regression and Model Building150 Questions
Exam 15: Process Improvement Using Control Charts117 Questions
Select questions type
All of the following are used to describe qualitative data except the ___________.
(Multiple Choice)
4.9/5  (38)
(38)
In the first step of setting up a Pareto chart,a frequency table should be constructed of the defects (or categories)in decreasing order of frequency.
(True/False)
4.8/5 (43)
The following is a relative frequency distribution of grades in an introductory statistics course. 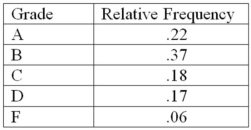 Construct a percent frequency bar chart for this data.
(Essay)
4.9/5 (35)
Using the following data,what would be the range of the values of the stem in a stem-and-leaf display? 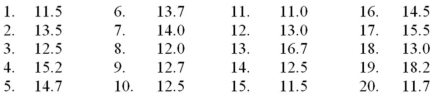
(Multiple Choice)
4.8/5 (37)
A bar chart is a graphic that can be used to depict qualitative data.
(True/False)
4.8/5 (38)
______________ and _____________ are used to describe qualitative (categorical)data.
(Multiple Choice)
4.8/5 (34)
A flaw possessed by a population or sample unit is ___________.
(Multiple Choice)
4.9/5 (34)
The following is a relative frequency distribution of grades in an introductory statistics course. 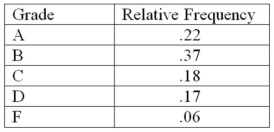 If this was the distribution of 200 students,find the frequency of failures.
(Multiple Choice)
4.9/5 (37)
The number of items rejected daily by a manufacturer because of defects for the last 30 days are:
20,21,8,17,22,19,18,19,14,17,11,6,21,25,4,19,9,12,16,16,10,28,24,6,21,20,25,5,17,8
Construct a stem-and-leaf plot.
(Essay)
4.7/5 (25)
A ______________ shows the relationship between two variables.
(Multiple Choice)
4.9/5 (37)
A company collected the ages from a random sample of its middle managers,with the resulting frequency distribution shown below. 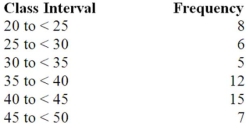 What is the relative frequency for the largest interval?
(Multiple Choice)
4.9/5 (39)
A graphical portrayal of a quantitative data set that divides the data into classes and gives the frequency of each class is a(n)___________.
(Multiple Choice)
4.7/5 (35)
The following table lists the types of customer complaint calls on satellite TV service during the first two months after installation. 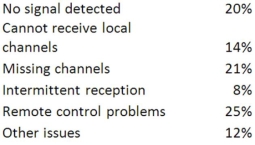 Construct a Pareto chart.
(Essay)
4.8/5 (39)
A _____________ displays the frequency of each group with qualitative data,and a _____________ displays the frequency of each group with quantitative data.
(Multiple Choice)
4.8/5 (31)
A local electronics retailer recently conducted a study on purchasers of large screen televisions.The study recorded the type of television and the credit account balance of the customer at the time of purchase.They obtained the following results. 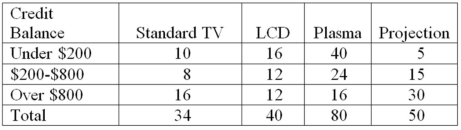 What percentage of the customers had the highest credit balances and purchased an LCD television?
(Multiple Choice)
4.9/5 (44)
A ______________ can be used to differentiate the vital few causes of quality problems from the trivial many causes of quality problems.
(Multiple Choice)
4.9/5 (31)
The US local airport keeps track of the percentage of flights arriving within 15 minutes of their scheduled arrivals.The stem-and-leaf plot of the data for one year is below.  What would be the class length for creating the frequency histogram?
(Multiple Choice)
4.7/5 (36)
If there are 120 values in a data set,how many classes should be created for a frequency histogram?
(Multiple Choice)
4.9/5 (28)
Filters
- Essay(0)
- Multiple Choice(0)
- Short Answer(0)
- True False(0)
- Matching(0)