Exam 2: Descriptive Statistics: Tabular and Graphical Methods
Exam 1: An Introduction to Business Statistics63 Questions
Exam 2: Descriptive Statistics: Tabular and Graphical Methods100 Questions
Exam 3: Descriptive Statistics: Numerical Methods141 Questions
Exam 4: Probability127 Questions
Exam 5: Discrete Random Variables150 Questions
Exam 6: Continuous Random Variables145 Questions
Exam 7: Sampling and Sampling Distributions131 Questions
Exam 8: Confidence Intervals149 Questions
Exam 9: Hypothesis Testing150 Questions
Exam 10: Statistical Inferences Based on Two Samples139 Questions
Exam 11: Experimental Design and Analysis of Variance98 Questions
Exam 12: Chi-Square Tests112 Questions
Exam 13: Simple Linear Regression Analysis140 Questions
Exam 14: Multiple Regression and Model Building150 Questions
Exam 15: Process Improvement Using Control Charts117 Questions
Select questions type
A local electronics retailer recently conducted a study on purchasers of large screen televisions.The study recorded the type of television and the credit account balance of the customer at the time of purchase.They obtained the following results. 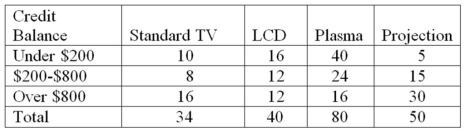 Construct a table of column percentages.
(Essay)
4.8/5  (39)
(39)
An example of manipulating a graphical display to distort reality is ___________.
(Multiple Choice)
4.7/5 (29)
When developing a frequency distribution,the class (group)intervals should be ___________.
(Multiple Choice)
4.9/5 (39)
The number of weekly sales calls by a sample of 25 pharmaceutical salespersons is below.
24,56,43,35,37,27,29,44,34,28,33,28,46,31,38,41,48,38,27,29,37,33,31,40,50
Construct a frequency polygon.
(Essay)
4.9/5 (33)
A very simple graph that can be used to summarize a quantitative data set is called a(n)___________.
(Multiple Choice)
4.7/5 (29)
Which of the following graphical tools is not used to study the shapes of distributions?
(Multiple Choice)
4.9/5 (30)
Consider the following data on distances traveled by people to visit the local amusement park and calculate the relative frequency for the shortest distance. 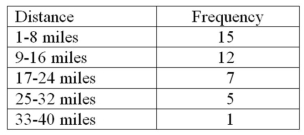
(Multiple Choice)
4.8/5 (29)
A company collected the ages from a random sample of its middle managers,with the resulting frequency distribution shown below. 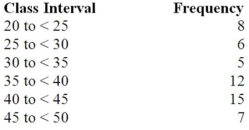 What is the midpoint of the third class interval?
(Multiple Choice)
4.9/5 (39)
Fill in the missing components of the following frequency distribution constructed for a sample size of 50. 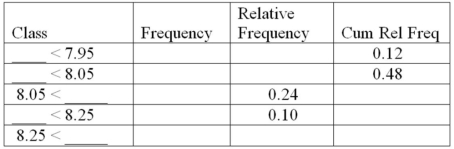
(Essay)
4.9/5 (29)
A CFO is looking at how much the company is spending on computing.He samples companies in the pharmaceutical industry and develops the following stem-and-leaf graph. 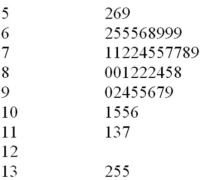 What is the smallest percentage spent on computing?
(Multiple Choice)
4.8/5 (35)
As a general rule,when creating a stem-and-leaf display,there should be ______ stem values.
(Multiple Choice)
4.7/5 (33)
If there are 30 values in a data set,how many classes should be created for a frequency histogram?
(Multiple Choice)
5.0/5 (38)
A company collected the ages from a random sample of its middle managers,with the resulting frequency distribution shown below.  What would be the approximate shape of the relative frequency histogram?
(Multiple Choice)
4.7/5 (35)
The number of measurements falling within a class interval is called the ___________.
(Multiple Choice)
4.9/5 (26)
The relative frequency is the frequency of a class divided by the total number of measurements.
(True/False)
4.8/5 (32)
The following is a partial relative frequency distribution of grades in an introductory statistics course. 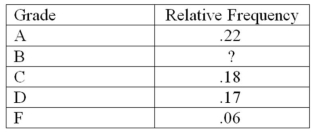 Find the relative frequency for the B grade.
(Multiple Choice)
4.8/5 (33)
The US local airport keeps track of the percentage of flights arriving within 15 minutes of their scheduled arrivals.The stem-and-leaf plot of the data for one year is below. 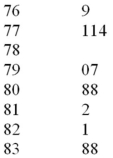 How many flights were used in this plot?
(Multiple Choice)
4.8/5 (31)
Filters
- Essay(0)
- Multiple Choice(0)
- Short Answer(0)
- True False(0)
- Matching(0)