Exam 1: Functions and Applications
Exam 1: Functions and Applications159 Questions
Exam 2: Nonlinear Functions and Models92 Questions
Exam 3: The Mathematics of Finance137 Questions
Exam 4: Systems of Linear Equations and Matrices111 Questions
Exam 5: Matrix Algebra and Applications174 Questions
Exam 6: Linear Programming161 Questions
Exam 7: Sets and Counting154 Questions
Exam 8: Probability257 Questions
Exam 9: Random Variables and Statistics178 Questions
Exam 10: Introduction to the Derivative139 Questions
Exam 11: Techniques of Differentiation104 Questions
Exam 12: Applications of the Derivative88 Questions
Exam 13: The Integral66 Questions
Exam 14: Further Integration Techniques and Applications of the Integral118 Questions
Exam 15: Functions of Several Variables137 Questions
Exam 16: Trigonometric Models67 Questions
Select questions type
In the Fahrenheit temperature scale, water freezes at 32°F and boils at 212°F. In the Celsius (or centigrade) scale, water freezes at 0°C and boils at 100°C. Assuming that the Fahrenheit temperature F and the Celsius temperature C are related by a linear equation, find the Celsius temperature that correspond to 121°F, to the nearest degree.
__________ °C
(Short Answer)
4.9/5  (23)
(23)
Decide which of the two given functions is linear and find its equation. 0 1 2 3 4 f(x) 1 -1.5 -4 -6.5 -9 ( ) 1 -2 -5 -8 -10
(Multiple Choice)
4.8/5 (44)
Find the coefficient of correlation of the line that best fits the data set.
(Multiple Choice)
4.8/5 (28)
In the Fahrenheit temperature scale, water freezes at 32°F and boils at 212°F. In the Celsius (or centigrade) scale, water freezes at 0°C and boils at 100°C. Assuming that the Fahrenheit temperature F and the Celsius temperature C are related by a linear equation, find the Fahrenheit temperature that corresponds to 61°C, to the nearest degree.
__________ °F
(Short Answer)
4.9/5 (34)
The height of the falling sheet of paper, in feet from the ground, is given by after t seconds.
When will the sheet of paper reach the ground
(Multiple Choice)
4.9/5 (43)
Find the coefficient of correlation of the line that best fits the data set.
Please give the answer to four decimal places if necessary.
(Short Answer)
4.8/5 (40)
Graph shows the number of sports utility vehicles sold in the United States. represents sales in year t in thousands of vehicles. Find . 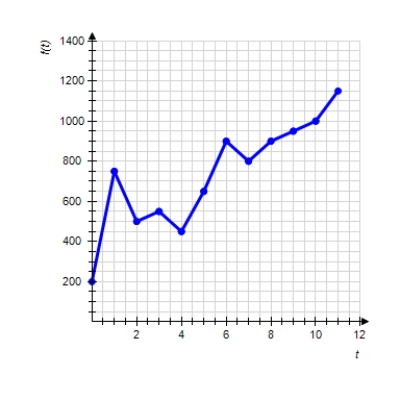
(Multiple Choice)
4.7/5 (42)
In the Fahrenheit temperature scale, water freezes at 32°F and boils at 212°F. In the Celsius (or centigrade) scale, water freezes at 0°C and boils at 100°C. Assuming that the Fahrenheit temperature F and the Celsius temperature C are related by a linear equation, find the Fahrenheit temperature that correspond to 26°C, to the nearest degree.
(Multiple Choice)
4.8/5 (37)
Graph shows the number of sports utility vehicles sold in the United States. represents sales in year t in thousands of vehicles. Use the graph to estimate the smallest value of for . 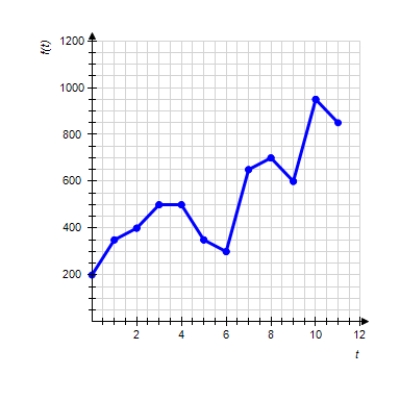
(Multiple Choice)
4.7/5 (29)
The following table shows the approximate value V of one Euro in U.S dollars from its introduction in January 2000 to January 2004. ( represents January, 2000.) ( Year ) 0 2 4 ( Value in ) 1.00 0.90 1.25 Which model would best fit the given data (A, a, b, c, k, l, and m are constants.)
(Multiple Choice)
4.8/5 (35)
Following are approximate values of the Amex Gold BUGS Index. Year 0 2 4 Index 50 100 250 ( represents 2000)
Obtain the associated regression line. (Round coefficients to 2 decimal places if necessary.) Use your regression equation to project the 2001 sales.
(Multiple Choice)
4.9/5 (31)
Calculate the slope of the straight line through the points and . Try to do the calculation mentally.
(Multiple Choice)
4.9/5 (37)
Find the best-fit line associated with the set of points. , , ,
(Multiple Choice)
4.8/5 (32)
You can sell 90 pet chias per week if they are marked as $1 each, but only 40 per week if they are marked $2 per chia. Your chia supplier is prepared to sell you 25 chias per week if they are marked $1 per chia, and 75 per week if they are marked $2 per chia. Write the associated linear demand and supply functions.
(Multiple Choice)
4.9/5 (29)
Graph shows the number of sports utility vehicles sold in the United States. represents sales in year t in thousands of vehicles. Find . 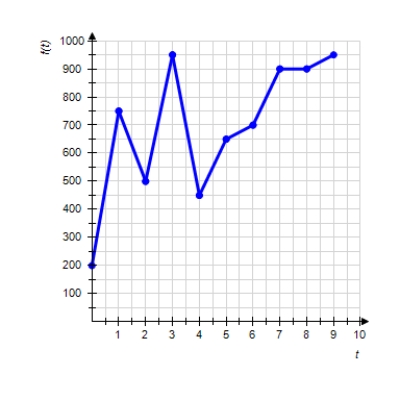
(Multiple Choice)
4.8/5 (34)
A police car was traveling down Ocean Parkway in a high-speed chase from Jones Beach. The car was at Jones Beach at exactly 9:00 p.m. , and was at Oak Beach, 13 miles from Jones Beach, at exactly 9:04 p.m. How fast was the police car traveling (Round your answer to the nearest tenth.)
(Multiple Choice)
4.8/5 (37)
Find the coefficient of correlation of the line that best fits the data set.
Please give the answer to four decimal places if necessary.
(Short Answer)
4.7/5 (35)
Filters
- Essay(0)
- Multiple Choice(0)
- Short Answer(0)
- True False(0)
- Matching(0)