Exam 1: Functions and Applications
Exam 1: Functions and Applications159 Questions
Exam 2: Nonlinear Functions and Models92 Questions
Exam 3: The Mathematics of Finance137 Questions
Exam 4: Systems of Linear Equations and Matrices111 Questions
Exam 5: Matrix Algebra and Applications174 Questions
Exam 6: Linear Programming161 Questions
Exam 7: Sets and Counting154 Questions
Exam 8: Probability257 Questions
Exam 9: Random Variables and Statistics178 Questions
Exam 10: Introduction to the Derivative139 Questions
Exam 11: Techniques of Differentiation104 Questions
Exam 12: Applications of the Derivative88 Questions
Exam 13: The Integral66 Questions
Exam 14: Further Integration Techniques and Applications of the Integral118 Questions
Exam 15: Functions of Several Variables137 Questions
Exam 16: Trigonometric Models67 Questions
Select questions type
Based on the following table, find . x -3 -2 -1 0 1 2 3 f(x) 2 7 2 -2 5 1.2 0.9
(Multiple Choice)
4.9/5  (35)
(35)
Find the linear equation that is the straight line through (25, -1) and increasing at a rate of 5 units of y per unit of x.
(Multiple Choice)
4.8/5 (40)
The Oliver company plans to market a new product. Based on its market studies, Oliver estimates that it can sell up to 6,000 units in 2005. The selling price will be $5 per unit. Variable costs are estimated to be 40% of total revenue. Fixed costs are estimated to be $15,000 for 2005. How many units should the company sell to break even
Number of units = __________
(Short Answer)
5.0/5 (37)
Use technology (such as spreadsheet web site utilities, or a graphing calculator) to evaluate the function for .
(Multiple Choice)
4.8/5 (28)
Graph shows the number of sports utility vehicles sold in the United States. represents sales in year t in thousands of vehicles. Use the graph to estimate the largest value of for .
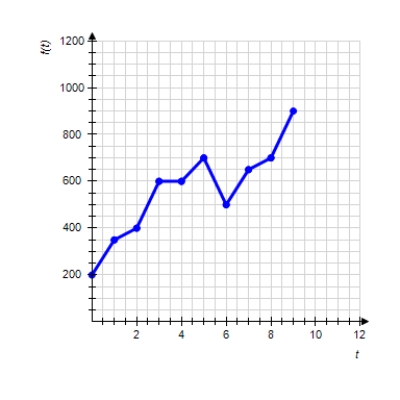
Please enter your answer as a number without the units.
Please enter your answer as a number without the units.
(Short Answer)
4.8/5 (28)
Find the best-fit line associated with the set of points.
, ,
Please enter your answer as an equation of line in the form . Round m and b to the nearest hundredth if necessary.
(Essay)
4.7/5 (36)
Annual federal spending on Medicare increased more or less linearly from $55 billion in 1973 to $160 billion in 1994. Use these data to express s, the annual spending on Medicare (in billions of dollars), as a linear function of t, the number of years since 1973.
(Essay)
4.9/5 (42)
Choose the graph of the function , domain from the following:
(Multiple Choice)
4.9/5 (39)
Find the equation of the given linear function. -2 0 2 4 ( ) 5 1 -3 -7
(Multiple Choice)
4.9/5 (36)
a) Find correlation coefficient to the set of data. Round the answer to 4 decimal places if necessary.
r = __________
b) Find correlation coefficient to the set of data. Round the answer to 4 decimal places if necessary.
r = __________
c) Find correlation coefficient to the set of data. Round the answer to 4 decimal places if necessary.
r = __________
Use correlation coefficients to determine which of the given sets of data is best fit by its associated regression line.
__________
Use correlation coefficients to determine which of the given sets of data is worst fit by its associated regression line .
Is it a perfect fit for any of the data sets
(Short Answer)
4.9/5 (43)
Calculate the slope of the straight line through the points and . Try to do the calculations mentally.
(Short Answer)
4.8/5 (31)
Find the best-fit line associated with the set of points. , ,
(Multiple Choice)
4.9/5 (37)
Graph shows the number of sports utility vehicles sold in the United States. represents sales in year t in thousands of vehicles. Use the graph to estimate the smallest value of for .
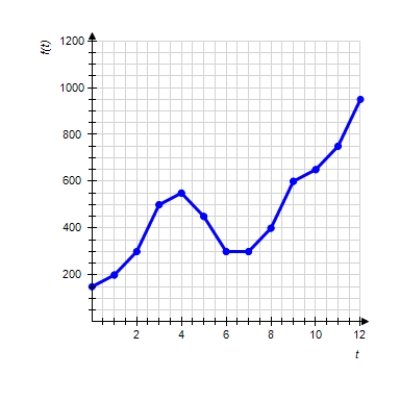
Please enter your answer as a number without the units.
Please enter your answer as a number without the units.
(Short Answer)
4.8/5 (32)
Based on the following table, find . x -3 -2 -1 0 1 2 3 f(x) 1 1 7 1 1 0.5 1.35
(Multiple Choice)
4.9/5 (23)
A police car was traveling down Ocean Parkway in a high-speed chase from Jones Beach. The car was at Jones Beach at exactly 9:00 p.m. , and was at Oak Beach, 13 miles from Jones Beach, at exactly 9:07 p.m. How fast, in miles per minute, was the police car traveling Round your answer to one decimal place.
v = __________
(Short Answer)
4.8/5 (35)
In 1950 the number of retirees was approximately 150 per thousand people aged 20-64. In 1990 this number rose to approximately 200, and it is projected to rise to 275 in 2020. Model N as a piecewise linear function of the time t in years since 1950, and use your model to project the number of retires per thousand people aged 20-64 in 1965. (Round you answer to the nearest integer.)
(Multiple Choice)
4.9/5 (32)
Filters
- Essay(0)
- Multiple Choice(0)
- Short Answer(0)
- True False(0)
- Matching(0)