Exam 23: Time-Series Analysis and Forecasting
Exam 1: What Is Statistics14 Questions
Exam 2: Types of Data, Data Collection and Sampling16 Questions
Exam 3: Graphical Descriptive Methods Nominal Data19 Questions
Exam 4: Graphical Descriptive Techniques Numerical Data64 Questions
Exam 5: Numerical Descriptive Measures147 Questions
Exam 6: Probability106 Questions
Exam 7: Random Variables and Discrete Probability Distributions55 Questions
Exam 8: Continuous Probability Distributions117 Questions
Exam 9: Statistical Inference: Introduction8 Questions
Exam 10: Sampling Distributions65 Questions
Exam 11: Estimation: Describing a Single Population127 Questions
Exam 12: Estimation: Comparing Two Populations22 Questions
Exam 13: Hypothesis Testing: Describing a Single Population129 Questions
Exam 14: Hypothesis Testing: Comparing Two Populations78 Questions
Exam 15: Inference About Population Variances49 Questions
Exam 16: Analysis of Variance115 Questions
Exam 17: Additional Tests for Nominal Data: Chi-Squared Tests110 Questions
Exam 18: Simple Linear Regression and Correlation213 Questions
Exam 19: Multiple Regression121 Questions
Exam 20: Model Building92 Questions
Exam 21: Nonparametric Techniques126 Questions
Exam 22: Statistical Inference: Conclusion103 Questions
Exam 23: Time-Series Analysis and Forecasting145 Questions
Exam 24: Index Numbers25 Questions
Exam 25: Decision Analysis51 Questions
Select questions type
Weekly toy sales (in $1000s) in a department store for the past three months are shown below. Month Week Sales 1 1 14 2 22 3 20 4 16 2 1 18 2 20 3 24 4 20 3 1 22 2 26 3 24 4 18 Compute the four-week centred moving averages.
Free
(Essay)
4.7/5  (36)
(36)
Correct Answer: Verified
The agricultural exports (in millions of dollars) from a Latin American country for 10 years are shown below. Year t Exports 1988 1 96 1989 2 110 1990 3 125 1991 4 141 1992 5 132 1993 6 126 1994 7 118 1995 8 125 1996 9 133 1997 10 148 a. Use the regression technique to calculate the linear trend line.
b. Calculate the percentage of trend.
c. Plot the percentage of trend.
d. Describe the cyclical effect (if there is one).
Free
(Essay)
4.9/5 (35)
Correct Answer:Verified
a.  .
.
b. 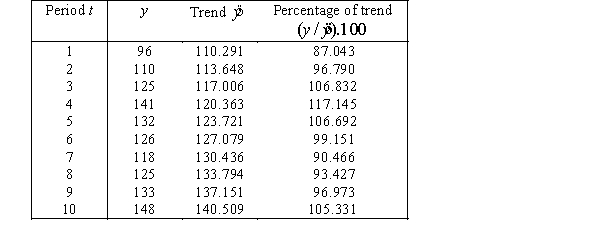 c.
c. 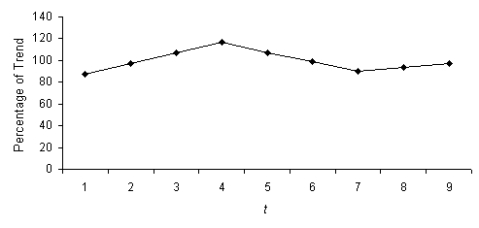 d. There appears to be a cyclical trend.
The linear model for long-term trend is , where t is the time period. The trend is indicated by:
Free
(Multiple Choice)
4.9/5 (35)
Correct Answer:Verified
B
A local newspaper that appears six days per week wanted to forecast two-day revenues from its business services classified ads section. The revenues (in $1000s) were recorded for the past 52 weeks. From these data, the following regression equation was computed:  , t = 1, 2, 3,…156,
where: = 1, if Monday or Tuesday
= 0, otherwise. = 1, if Wednesday or Thursday
= 0, otherwise.
Forecast the two-day revenues for the next week.
, t = 1, 2, 3,…156,
where: = 1, if Monday or Tuesday
= 0, otherwise. = 1, if Wednesday or Thursday
= 0, otherwise.
Forecast the two-day revenues for the next week.
(Essay)
4.9/5 (36)
The following linear trend was estimated using a time series regression with the origin in the year 2000. ŷ = 76.80 + 3.14t.
Which of the following is the forecast for the year 2013?
(Multiple Choice)
4.8/5 (40)
If we wanted to measure the seasonal variations on stock market performance by quarter, we would need:
(Multiple Choice)
4.8/5 (31)
We calculate the five-period moving average for a time series for all time periods except the:
(Multiple Choice)
4.9/5 (41)
Given the following time series, compute the seasonal (quarterly) indexes, using the four-quarter centred moving averages. Quarter 1993 1994 1995 1996 1997 1 62 48 50 43 57 2 51 45 46 39 32 3 53 44 46 37 31 4 46 37 42 32 29
(Essay)
4.9/5 (41)
The following seasonal indexes and trend line were computed from five years of quarterly sales data.
Trend line: ŷt = 325 + 18.5t, t = 1, 2, 3, …20. Quarter Seasonal index 1 1.35 2 1.22 3 0.88 4 0.55 Forecast the sales for the next four quarters.
(Essay)
4.9/5 (43)
The effect that business recessions and prosperity have on time-series values is an example of the disaster component of a time series.
(True/False)
4.7/5 (44)
Regression analysis was used to develop the following equation from 60 observations of quarterly data:  ,
where: = 1, if quarter i (i = 1, 2, 3)
= 0, otherwise
Forecast the next four quarters.
,
where: = 1, if quarter i (i = 1, 2, 3)
= 0, otherwise
Forecast the next four quarters.
(Essay)
4.8/5 (41)
A trend is one of the four different components of a time series. It is a long-term, relatively smooth pattern or direction exhibited by a series, and its duration is more than one year.
(True/False)
4.9/5 (41)
Which of the following represents the fluctuations up to a twelve month time period?
(Multiple Choice)
4.9/5 (30)
A company selling swimming goggles wants to analyze the company's Australian sales time figures.
Time series forecasting with regression was used to generate Excel output to estimate trend of the time series of Swimming goggle sales (in thousands of dollars) where the origin is the March Quarter 2000.
Regression Statistics Multiple R 0.37281 R Square 0.13899 Adjusted R Square 0.12243 StandardError 10.3925 Observations 54
ANOVA df SS MS F Significance F Regression 1 906.5867925 906.59 839406 0.005497292 Residual 52 5616.172467 108 Total 53 6522.759259
Standard Coefficients Error tStat P-value Lower 95\% Upper 95\% Interoept 12.237 2.789633876 4.3866 5.6-05 6.639227133 17.8348469 0.26289 0.090738795 2.8973 0.0055 0.080812368 0.4449738 Interpret the 95% confidence interval for time t.
(Essay)
4.7/5 (34)
Smoothing time-series data by the moving average method or exponential smoothing method is an attempt to remove the effect of the:
(Multiple Choice)
4.8/5 (39)
The term in the equation , where ?t represents the predicted value of y at time t, is:
(Multiple Choice)
4.7/5 (38)
a. Apply exponential smoothing with w = 0.1 and w = 0.8 to help detect the components of the following time series. Period t yt 1 40 2 45 3 44 4 47 5 48 6 50 7 52 8 51 9 48 10 47 b. Draw the time series and the two sets of exponentially smoothed values. Does there appear to be a trend component in the time series?
(Essay)
4.9/5 (50)
A time series regression equation for a surfboard manufacturing company in Australia is given below: Y = 35 + 4Q1 + 0.5Q3 + 8Q4 + 3t
With t in quarters and the origin is December 2010 and Q1 is the indicator variable for March, Q3 is the indicator variable for September and Q4 is the indicator variable for December.
Which of the following statements is correct?
(Multiple Choice)
4.9/5 (41)
The trend line ?t = 14.13 - 0.54t was calculated from quarterly data for 2006-2010, where t = 1 for the first quarter of 2006. The trend value for the fourth quarter of the year 2011 is 1.170.
(True/False)
4.9/5 (42)
Suppose that we calculate the four-period moving average of the following time series: t 1 2 3 4 5 6 18 28 23 17 26 14 The centred moving average for period 4 is:
(Multiple Choice)
4.8/5 (29)
Filters
- Essay(0)
- Multiple Choice(0)
- Short Answer(0)
- True False(0)
- Matching(0)