Exam 18: Simple Linear Regression and Correlation
Exam 1: What Is Statistics14 Questions
Exam 2: Types of Data, Data Collection and Sampling16 Questions
Exam 3: Graphical Descriptive Methods Nominal Data19 Questions
Exam 4: Graphical Descriptive Techniques Numerical Data64 Questions
Exam 5: Numerical Descriptive Measures147 Questions
Exam 6: Probability106 Questions
Exam 7: Random Variables and Discrete Probability Distributions55 Questions
Exam 8: Continuous Probability Distributions117 Questions
Exam 9: Statistical Inference: Introduction8 Questions
Exam 10: Sampling Distributions65 Questions
Exam 11: Estimation: Describing a Single Population127 Questions
Exam 12: Estimation: Comparing Two Populations22 Questions
Exam 13: Hypothesis Testing: Describing a Single Population129 Questions
Exam 14: Hypothesis Testing: Comparing Two Populations78 Questions
Exam 15: Inference About Population Variances49 Questions
Exam 16: Analysis of Variance115 Questions
Exam 17: Additional Tests for Nominal Data: Chi-Squared Tests110 Questions
Exam 18: Simple Linear Regression and Correlation213 Questions
Exam 19: Multiple Regression121 Questions
Exam 20: Model Building92 Questions
Exam 21: Nonparametric Techniques126 Questions
Exam 22: Statistical Inference: Conclusion103 Questions
Exam 23: Time-Series Analysis and Forecasting145 Questions
Exam 24: Index Numbers25 Questions
Exam 25: Decision Analysis51 Questions
Select questions type
An ardent fan of television game shows has observed that, in general, the more educated the contestant, the less money he or she wins. To test her belief, she gathers data about the last eight winners of her favourite game show. She records their winnings in dollars and their years of education and performs a simple linear regression, with the Excel output provided . Contestant Years of education Winnings 1 11 750 2 15 400 3 12 600 4 16 350 5 11 800 6 16 300 7 13 650 8 14 400 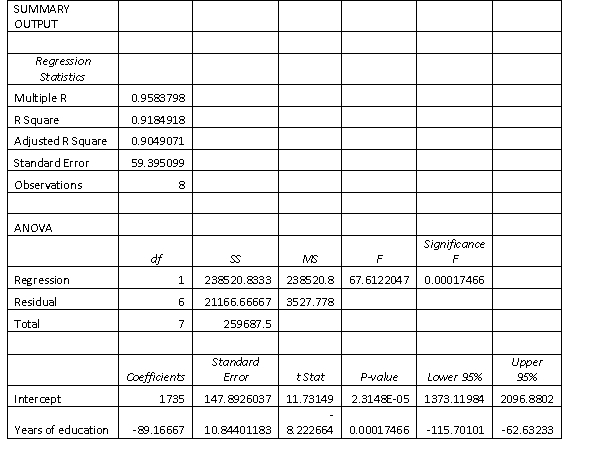 a. Determine the least squares regression line.
b. Interpret the value of the slope of the regression line.
c. Determine the standard error of estimate, and describe what this statistic tells you about the regression line.
d. Interpret the coefficient of correlation
a. Determine the least squares regression line.
b. Interpret the value of the slope of the regression line.
c. Determine the standard error of estimate, and describe what this statistic tells you about the regression line.
d. Interpret the coefficient of correlation
Free
(Essay)
4.8/5  (30)
(30)
Correct Answer: Verified
a.  1735 - 89.1667x.
b. For each additional year of education a contestant has, his or her winnings on TV game shows decrease on average by $89.1667.
c. 59.395; the model's fit is good.
d. r = -0.9584, There is a negative, strong, linear relationship between years of education and winnings.
Predict weekly sales in the fast food restaurant if 10 vouchers are printed in the local newspaper,
given Estimated Sales = 11.5676 + 0.4618.Vouchers
Is this a good estimate?
Free
(Essay)
4.8/5 (37)
Correct Answer:Verified
Estimated Sales = 11.5676 + 0.4618(10) = 16.1856 in $000's so $16 185.60.
This is a good estimate as 72.67% of the variation in weekly sales in this fast food restaurant is explained by this linear model on number of vouchers.
In order to estimate with 95% confidence a particular value of for a given value of in a simple linear regression problem, a random sample of 20 observations is taken. The appropriate table value that would be used is 2.101.
Free
(True/False)
4.8/5 (39)
Correct Answer:Verified
True
The editor of a major academic book publisher claims that a large part of the cost of books is the cost of paper. This implies that larger books will cost more money. As an experiment to analyse the claim, a university student visits the bookstore and records the number of pages and the selling price of 12 randomly selected books. These data are listed below. Determine the least squares regression line.
(Essay)
4.9/5 (31)
In a simple linear regression problem, the least squares line is  = -3.75 + 1.25 , and the coefficient of determination is 0.81. The coefficient of correlation must be 0.90.
(True/False)
4.7/5 (23)
In simple linear regression, most often we perform a two-tail test of the population slope to determine whether there is sufficient evidence to infer that a linear relationship exists. Which of the following best describes the null and alternative hypotheses needed for a test of significance?
(Multiple Choice)
4.9/5 (32)
Given that cov(x,y) = 10, = 15, = 8 and n = 12, the value of the standard error of estimate, , is 2.75.
(True/False)
4.8/5 (36)
Would the test of the significance of the overall equation have the same conclusion as the test of significance of the slope in a simple linear regression model of weekly sales in a fast food restaurant on number of vouchers printed in the local newspaper? Explain.
(Essay)
4.9/5 (28)
Another name for the residual term in a regression equation is random error.
(True/False)
4.9/5 (37)
At a recent music concert, a survey was conducted that asked a random sample of 20 people their age and how many concerts they have attended since the beginning of the year. The following data were collected. Age 62 57 40 49 67 54 43 65 54 41 Number of concerts 6 5 4 3 5 5 2 6 3 1 Age 44 48 55 60 59 63 69 40 38 52 Number of Concerts 3 2 4 5 4 5 4 2 1 3 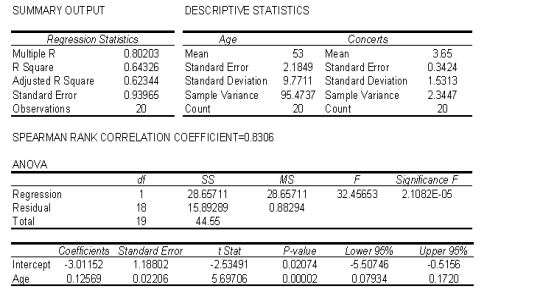 a. Use the regression equation
  -3.0115 + 0.1257x to determine the predicted values of y.
b. Use the predicted values and the actual values of y to calculate the residuals.
c. Plot the residuals against the predicted values 11ee4fcc_f430_90bf_ae1e_57d339dcb288_TB5762_11 .
d. Does it appear that heteroscedasticity is a problem? Explain.
e. Draw a histogram of the residuals.
f. Does it appear that the errors are normally distributed? Explain.
g. Use the residuals to compute the standardised residuals.
h. Identify possible outliers.
-3.0115 + 0.1257x to determine the predicted values of y.
b. Use the predicted values and the actual values of y to calculate the residuals.
c. Plot the residuals against the predicted values 11ee4fcc_f430_90bf_ae1e_57d339dcb288_TB5762_11 .
d. Does it appear that heteroscedasticity is a problem? Explain.
e. Draw a histogram of the residuals.
f. Does it appear that the errors are normally distributed? Explain.
g. Use the residuals to compute the standardised residuals.
h. Identify possible outliers.
(Essay)
4.8/5 (41)
A financier whose specialty is investing in movie productions has observed that, in general, movies with 'big-name' stars seem to generate more revenue than those movies whose stars are less well known. To examine his belief, he records the gross revenue and the payment (in $ million) given to the two highest-paid performers in the movie for 10 recently released movies. Movie Cost of two highest- paid performers (\ ) Gross revenue (\ ) 1 5.3 48 2 7.2 65 3 1.3 18 4 1.8 20 5 3.5 31 6 2.6 26 7 8.0 73 8 2.4 23 9 4.5 39 10 6.7 58 Predict with 95% confidence the gross revenue of a movie whose top two stars earn $5.0 million.
(Essay)
4.9/5 (28)
A statistician investigating the relationship between the amount of precipitation (in inches) and the number of car accidents gathered data for 10 randomly selected days. The results are presented below. Day Precipitation Number of accidents 1 0.05 5 2 0.12 6 3 0.05 2 4 0.08 4 5 0.10 8 6 0.35 14 7 0.15 7 8 0.30 13 9 0.10 7 10 0.20 10 Do these data allow us to conclude at the 10% significance level that the amount of precipitation and the number of accidents are linearly related?
(Essay)
4.9/5 (41)
If all the values of an independent variable x are equal, then regressing a dependent variable y on x will result in a coefficient of determination of 100%.
(True/False)
4.9/5 (23)
At a recent music concert, a survey was conducted that asked a random sample of 20 people their age and how many concerts they have attended since the beginning of the year. The following data were collected. Age 62 57 40 49 67 54 43 65 54 41 Number of concerts 6 5 4 3 5 5 2 6 3 1 Age 44 48 55 60 59 63 69 40 38 52 Number of Concerts 3 2 4 5 4 5 4 2 1 3  a. Calculate the Pearson correlation coefficient. What sign does it have? Why?
b. Conduct a test of the population coefficient of correlation to determine at the 5% significance level whether a linear relationship exists between age and number of concerts attended.
a. Calculate the Pearson correlation coefficient. What sign does it have? Why?
b. Conduct a test of the population coefficient of correlation to determine at the 5% significance level whether a linear relationship exists between age and number of concerts attended.
(Essay)
4.8/5 (32)
In developing a 90% confidence interval for the expected value of y from a simple linear regression problem involving a sample of size 15, the appropriate table value would be 1.761.
(True/False)
4.8/5 (41)
Test the hypothesis that the slope is significantly greater than 0.40 at the 5% level of significance.
(Essay)
4.9/5 (41)
Given that SSE = 150 and SSR = 450, the proportion of the variation in y that is explained by the variation in x is 0.75.
(True/False)
4.9/5 (38)
The quality of oil is measured in API gravity degrees - the higher the degrees API, the higher the quality. The table shown below is produced by an expert in the field, who believes that there is a relationship between quality and price per barrel. Oil degrees API Price per barrel (in \ ) 27.0 12.02 28.5 12.04 30.8 12.32 31.3 12.27 31.9 12.49 34.5 12.70 34.0 12.80 34.7 13.00 37.0 13.00 41.0 13.17 41.0 13.19 38.8 13.22 39.3 13.27 A partial Minitab output follows.
Descriptive Statistics Variable Mean StDev SE Mean Degrees 13 34.60 4.613 1.280 Frice 13 12.730 0.457 0.127 Covariances Degrees Price Degrees 21.281667 Price 2.026750 0.208833 Regression Analysis Predictor Coef StDev Constant 9.4349 0.2867 32.91 0.000 Degrees 0.095235 0.008220 11.59 0.000 S = 0.1314 R-Sq = 92.46% R-Sq(adj) = 91.7%
Analysis of Variance Source DF SS MS F P Regression 1 2.3162 2.3162 134.24 0.000 Residual Error 11 0.1898 0.0173 Total 12 2.5060 a. Determine the standard error of estimate and describe what this statistic tells you.
b. Determine the coefficient of determination and discuss what its value tells you about the two variables.
c. Calculate the Pearson correlation coefficient. What sign does it have? Why?
(Essay)
4.9/5 (33)
The editor of a major academic book publisher claims that a large part of the cost of books is the cost of paper. This implies that larger books will cost more money. As an experiment to analyse the claim, a university student visits the bookstore and records the number of pages and the selling price of 12 randomly selected books. These data are listed below. Estimate with 90% confidence the mean selling price of all books with 900 pages.
(Essay)
4.7/5 (31)
Filters
- Essay(0)
- Multiple Choice(0)
- Short Answer(0)
- True False(0)
- Matching(0)