Exam 22: Statistical Inference: Conclusion
Exam 1: What Is Statistics14 Questions
Exam 2: Types of Data, Data Collection and Sampling16 Questions
Exam 3: Graphical Descriptive Methods Nominal Data19 Questions
Exam 4: Graphical Descriptive Techniques Numerical Data64 Questions
Exam 5: Numerical Descriptive Measures147 Questions
Exam 6: Probability106 Questions
Exam 7: Random Variables and Discrete Probability Distributions55 Questions
Exam 8: Continuous Probability Distributions117 Questions
Exam 9: Statistical Inference: Introduction8 Questions
Exam 10: Sampling Distributions65 Questions
Exam 11: Estimation: Describing a Single Population127 Questions
Exam 12: Estimation: Comparing Two Populations22 Questions
Exam 13: Hypothesis Testing: Describing a Single Population129 Questions
Exam 14: Hypothesis Testing: Comparing Two Populations78 Questions
Exam 15: Inference About Population Variances49 Questions
Exam 16: Analysis of Variance115 Questions
Exam 17: Additional Tests for Nominal Data: Chi-Squared Tests110 Questions
Exam 18: Simple Linear Regression and Correlation213 Questions
Exam 19: Multiple Regression121 Questions
Exam 20: Model Building92 Questions
Exam 21: Nonparametric Techniques126 Questions
Exam 22: Statistical Inference: Conclusion103 Questions
Exam 23: Time-Series Analysis and Forecasting145 Questions
Exam 24: Index Numbers25 Questions
Exam 25: Decision Analysis51 Questions
Select questions type
A statistics course at a large university is taught in each semester. A student has noticed that the students in semester 1 and semester 2 are enrolled in different degrees. To investigate, the student takes a random sample of 25 students from semester 1 and 25 students from semester 2 and records their final marks (%) provided in the table below. Excel was used to generate descriptive statistics on each sample.
Assume that student final marks are normally distributed in each semester. 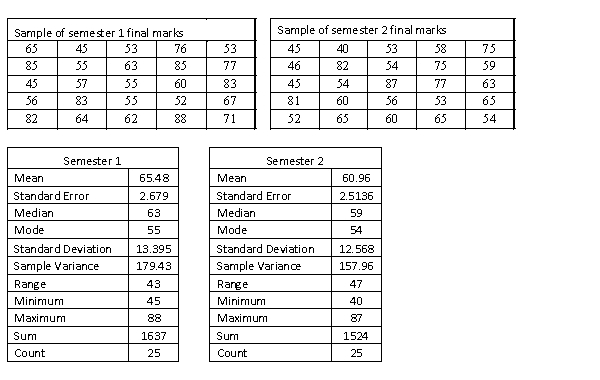 Estimate and interpret a 95% confidence interval for the proportion of semester 2 students that passed the course.
Free
(Essay)
4.7/5  (36)
(36)
Correct Answer: Verified
p hat = sample proportion of semester 2 students that passed the course = 21/25 = 0.84
0.84 ± 1.96[(0.84x0.16)/25]1/2 = (0.69, 0.98)
We are 95 % confident that the population proportion of semester 2 students that passed the course lies between 69% and 98%.
The irradiation of food to destroy bacteria is an increasingly common practice. In order to determine which one of two methods of irradiation is best, a scientist took a random sample of 100 one-kilogram packages of minced meat and subjected 50 of them to irradiation method 1 and the remaining 50 to irradiation method 2. The bacteria counts were measured and the following statistics were computed. The scientist noted that the data were normally distributed. Method 1 Method 2 =86 =98 =324 =841 Estimate with 95% confidence the difference in the mean bacteria counts between method 1 and method 2.
Free
(Short Answer)
4.8/5 (30)
Correct Answer:Verified
-12 ± 9.604 = (-21.604, -2.396).
Assuming that all necessary conditions are met, what needs to be changed in the formula so that we can use it to construct a confidence interval estimate for the difference of two population means when the population variances are assumed to be equal?
Free
(Multiple Choice)
4.8/5 (39)
Correct Answer:Verified
C
Two independent samples of sizes 50 and 50 are randomly selected from two populations to test the difference between the population means, . The sampling distribution of the sample mean difference is:
(Multiple Choice)
4.8/5 (26)
From a sample of 500 items, 30 were found to be defective. The point estimate of the population proportion defective will be:
(Multiple Choice)
4.9/5 (35)
There are different approaches to fitness training. To judge which one of two approaches is better, 200 25-year-old men were randomly selected to participate in an experiment. For four weeks, 100 men were trained according to approach 1 while the other 100 men were trained according to approach 2. The percentage improvement in fitness was measured for each man and the statistics shown below were computed. The percentage figures are known to be normally distributed. Approach 1 Approach 2 =27.3 =33.6 =47.614 =28.09 Scientists are interested in determining which of the two approaches more consistently improves fitness. Do these results allow us to conclude at the 10% significance level that approach 2 results in a more consistent improvement in fitness than approach 1?
(Essay)
5.0/5 (35)
Videocassette recorder (VCR) tapes are designed so that users can repeatedly record new material over old material. However, after a number of re-recordings the tape begins to deteriorate. A VCR tape manufacturer is experimenting with a new technology, which hopefully will produce longer-lasting tapes. Thirty of the old-style tapes and 30 utilising the new technology were used in an experiment. The tapes were used to record and re-record programs until they began to deteriorate. The number of re-recordings is assumed to be normally distributed. It is generally accepted that the number of re-recordings should exceed 55. Any tapes that do not meet this criterion are considered to be unacceptable. The number of re-recordings were observed and shown in the accompanying table. Old-style tapes New-technology tapes 60 61 48 68 70 58 51 46 66 74 72 69 66 63 61 77 73 49 73 55 71 59 66 61 71 49 76 52 58 59 47 56 55 66 51 49 60 62 64 62 59 57 52 51 63 51 56 66 64 68 52 50 55 76 47 55 58 63 68 78 Estimate with 90% confidence the difference in the mean number of re-recordings between the old and new tapes.
(Essay)
4.8/5 (36)
Based on sample data, the 95% confidence interval limits for the population mean are LCL = 124.6 and UCL = 148.2. If the 5% level of significance were used in testing the hypotheses:
H0 : = 150
H1 : 150,
The null hypothesis:
(Multiple Choice)
4.8/5 (33)
Two independent samples of sizes 35 and 40 are randomly selected from two normally distributed populations. Assume that the population variances are unknown but equal. In order to test the difference between the population means, , the sampling distribution of the sample mean difference, , is:
(Multiple Choice)
4.7/5 (39)
In constructing a 95% interval estimate for the ratio of two population variances, / , two independent samples of sizes 30 and 40 are drawn from the populations. If the sample variances are 425 and 675, then the upper confidence limit is about:
(Multiple Choice)
4.8/5 (35)
When the necessary conditions are met, a two-tail test is being conducted to test the difference between two population proportions. The two sample proportions are = 0.32 and = 0.38, and the standard error of the sampling distribution of is 0.046. The calculated value of the test statistic will be 1.3043.
(True/False)
4.8/5 (34)
The irradiation of food to destroy bacteria is an increasingly common practice. In order to determine which one of two methods of irradiation is best, a scientist took a random sample of 100 one-kilogram packages of minced meat and subjected 50 of them to irradiation method 1 and the remaining 50 to irradiation method 2. The bacteria counts were measured and the following statistics were computed. The scientist noted that the data were normally distributed. Method 1 Method 2 =86 =98 =324 =841 Estimate with 95% confidence the variance of the bacteria count with method 1, and briefly describe what this interval estimate tells you.
(Essay)
4.7/5 (41)
A statistics course at a large university is taught in each semester. A student has noticed that the students in semester 1 and semester 2 are enrolled in different degrees. To investigate, the student takes a random sample of 25 students from semester 1 and 25 students from semester 2 and records their final marks (%) provided in the table below. Excel was used to generate descriptive statistics on each sample.
Assume that student final marks are normally distributed in each semester.  Estimate a 95% confidence interval for the difference in the proportions of students who received a high distinction in semester 1 to semester 2.
(Essay)
4.8/5 (36)
If a sample of size 300 is selected, the value of A for the probability P(-A tdf=n-1 A) = 0.90 is 1.96.
(True/False)
4.9/5 (33)
Videocassette recorder (VCR) tapes are designed so that users can repeatedly record new material over old material. However, after a number of re-recordings the tape begins to deteriorate. A VCR tape manufacturer is experimenting with a new technology, which hopefully will produce longer-lasting tapes. Thirty of the old-style tapes and 30 utilising the new technology were used in an experiment. The tapes were used to record and re-record programs until they began to deteriorate. The number of re-recordings is assumed to be normally distributed. It is generally accepted that the number of re-recordings should exceed 55. Any tapes that do not meet this criterion are considered to be unacceptable. The number of re-recordings were observed and shown in the accompanying table. Old-style tapes New-technology tapes 60 61 48 68 70 58 51 46 66 74 72 69 66 63 61 77 73 49 73 55 71 59 66 61 71 49 76 52 58 59 47 56 55 66 51 49 60 62 64 62 59 57 52 51 63 51 56 66 64 68 52 50 55 76 47 55 58 63 68 78 a. Can we infer at the 10% significance level that the number of re-recordings of the old tapes is more consistent than the number of re-recordings of the new tapes?
b. Do the data allow us to infer at the 10% significance level that the proportion of unacceptable old tapes exceeds 20%?
c. Find the p-value of the test.
(Essay)
4.8/5 (34)
A statistics course at a large university is taught in each semester. A student has noticed that the students in semester 1 and semester 2 are enrolled in different degrees. To investigate, the student takes a random sample of 25 students from semester 1 and 25 students from semester 2 and records their final marks (%) provided in the table below. Excel was used to generate descriptive statistics on each sample.
Assume that student final marks are normally distributed in each semester.  Estimate and interpret a 90% confidence interval of the ratio of population variances of final student marks from semester 1 and semester 2.
(Essay)
4.9/5 (35)
A sample of size 300 had 96 successes. The lower limit of the 99% confidence interval for the population proportion is:
(Multiple Choice)
4.9/5 (42)
A statistics course at a large university is taught in each semester. A student has noticed that the students in semester 1 and semester 2 are enrolled in different degrees. To investigate, the student takes a random sample of 25 students from semester 1 and 25 students from semester 2 and records their final marks (%) provided in the table below. Excel was used to generate descriptive statistics on each sample.
Assume that student final marks are normally distributed in each semester. 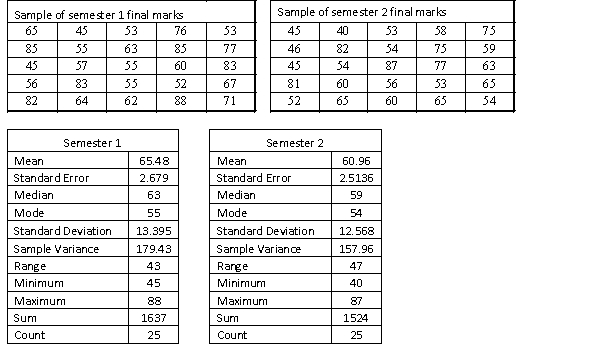 There is a rumor going around the university that students with a higher IQ are enrolled in the semester 1 statistics course because they tend to be students enrolled in the degree with the higher entrance score for university. Can it be concluded at the 5% significance level that semester 1 students have a higher average final mark than semester 2 students? Assume that the population variances are unknown and equal.
(Essay)
4.8/5 (32)
When the necessary conditions are met, a two-tail test is being conducted to test the difference between two population proportions. The two sample proportions are = 0.21 and = 0.15, and the standard error of the sampling distribution of are - is 0.018. The calculated value of the test statistic will be:
(Multiple Choice)
4.8/5 (33)
In testing the hypotheses: H0 : = 140
H1 : 140,
Suppose that we rejected the null hypothesis at = 0.10. Then for which of the following values do we also reject the null hypothesis?
(Multiple Choice)
4.8/5 (25)
Filters
- Essay(0)
- Multiple Choice(0)
- Short Answer(0)
- True False(0)
- Matching(0)